CAT Exam  >  CAT Tests  >  Test: Bar Graphs- 4 - CAT MCQ

Test: Bar Graphs- 4 - CAT MCQ


Test Description

5 Questions MCQ Test - Test: Bar Graphs- 4

Test: Bar Graphs- 4 for CAT 2024 is part of CAT preparation. The Test: Bar Graphs- 4 questions and answers have been prepared according to the CAT exam syllabus.The Test: Bar Graphs- 4 MCQs are made for CAT 2024 Exam. Find important definitions, questions, notes, meanings, examples, exercises, MCQs and online tests for Test: Bar Graphs- 4 below.
Solutions of Test: Bar Graphs- 4 questions in English are available as part of our course for CAT & Test: Bar Graphs- 4 solutions in Hindi for CAT course. Download more important topics, notes, lectures and mock test series for CAT Exam by signing up for free. Attempt Test: Bar Graphs- 4 | 5 questions in 10 minutes | Mock test for CAT preparation | Free important questions MCQ to study for CAT Exam | Download free PDF with solutions
Test: Bar Graphs- 4 - Question 1

Out of the two bar graphs provided below, one shows the amounts (in Lakh Rs.) invested by a Company in purchasing raw materials over the years and the other shows the values (in Lakh Rs.) of finished goods sold by the Company over the years.
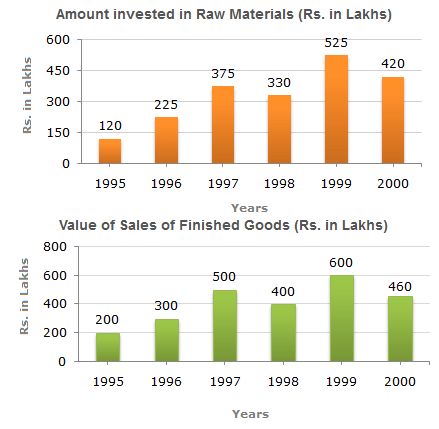
Q.

The maximum difference between the amount invested in Raw materials and value of sales of finished goods was during the year?

Detailed Solution for Test: Bar Graphs- 4 - Question 1

The differences between the amount invested in raw material and the value of sales of finished goods for various years are:

For 1995 = Rs. (200 - 120) lakhs = Rs. 80 lakhs.

For 1996 = Rs. (300 - 225) lakhs = Rs. 75 lakhs.

For 1997 = Rs. (500 - 375) lakhs = Rs. 125 lakhs.

For 1998 = Rs. (400 - 330) lakhs = Rs. 70 lakhs.

For 1999 = Rs. (600 - 525) lakhs = Rs. 75 lakhs.

For 2000 = Rs. (460 - 420) lakhs = Rs. 40 lakhs.

Clearly, maximum difference was during 1997.

Test: Bar Graphs- 4 - Question 2

Out of the two bar graphs provided below, one shows the amounts (in Lakh Rs.) invested by a Company in purchasing raw materials over the years and the other shows the values (in Lakh Rs.) of finished goods sold by the Company over the years.

The value of sales of finished goods in 1999 was approximately what percent of the sum of amount invested in Raw materials in the years 1997, 1998 and 1999?

Detailed Solution for Test: Bar Graphs- 4 - Question 2

1 Crore+ students have signed up on EduRev. Have you? Download the App
Test: Bar Graphs- 4 - Question 3

Out of the two bar graphs provided below, one shows the amounts (in Lakh Rs.) invested by a Company in purchasing raw materials over the years and the other shows the values (in Lakh Rs.) of finished goods sold by the Company over the years.

What was the difference between the average amount invested in Raw materials during the given period and the average value of sales of finished goods during this period?

Detailed Solution for Test: Bar Graphs- 4 - Question 3

Test: Bar Graphs- 4 - Question 4

Out of the two bar graphs provided below, one shows the amounts (in Lakh Rs.) invested by a Company in purchasing raw materials over the years and the other shows the values (in Lakh Rs.) of finished goods sold by the Company over the years.

In which year, the percentage change (compared to the previous year) in the investment on Raw materials is same as that in the value of sales of finished goods?

Detailed Solution for Test: Bar Graphs- 4 - Question 4

The percentage change in the amount invested in raw-materials and in the value of sales of finished goods for different years are:

Test: Bar Graphs- 4 - Question 5

Out of the two bar graphs provided below, one shows the amounts (in Lakh Rs.) invested by a Company in purchasing raw materials over the years and the other shows the values (in Lakh Rs.) of finished goods sold by the Company over the years.

In which year, there has been a maximum percentage increase in the amount invested in Raw materials as compared to the previous year?

Detailed Solution for Test: Bar Graphs- 4 - Question 5

The percentage increase in the amount invested in raw-materials as compared to the previous year, for different years are:

Information about Test: Bar Graphs- 4 Page
In this test you can find the Exam questions for Test: Bar Graphs- 4 solved & explained in the simplest way possible. Besides giving Questions and answers for Test: Bar Graphs- 4, EduRev gives you an ample number of Online tests for practice

Top Courses for CAT

Download as PDF

Top Courses for CAT