Test: Line Charts- 4 - CAT MCQ
5 Questions MCQ Test - Test: Line Charts- 4

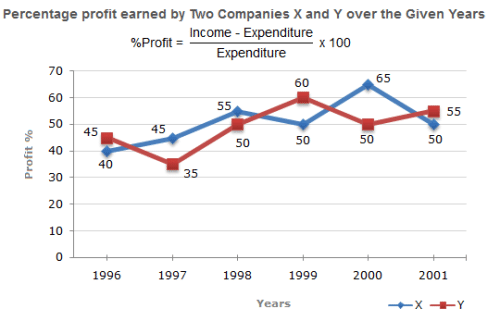
The following line graph gives the percent profit earned by two Companies X and Y during the period 1996 - 2001.
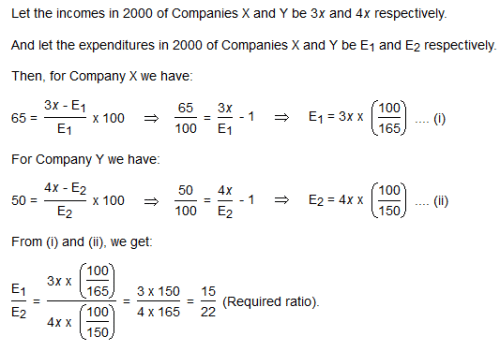
The incomes of two Companies X and Y in 2000 were in the ratio of 3:4 respectively. What was the respective ratio of their expenditures in 2000 ?
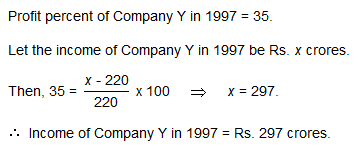
If the expenditure of Company Y in 1997 was Rs. 220 crores, what was its income in 1997 ?

The following line graph gives the percent profit earned by two Companies X and Y during the period 1996 - 2001.
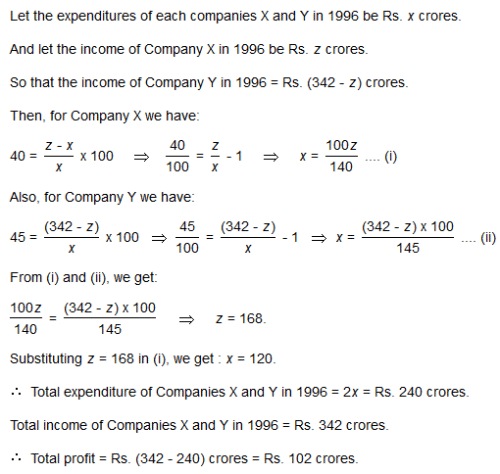
If the expenditures of Company X and Y in 1996 were equal and the total income of the two Companies in 1996 was Rs. 342 crores, what was the total profit of the two Companies together in 1996 ? (Profit = Income - Expenditure)
The following line graph gives the percent profit earned by two Companies X and Y during the period 1996 - 2001.
The expenditure of Company X in the year 1998 was Rs. 200 crores and the income of company X in 1998 was the same as its expenditure in 2001. The income of Company X in 2001 was ?
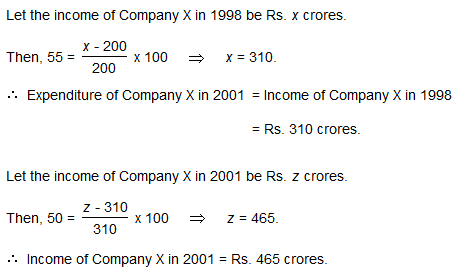
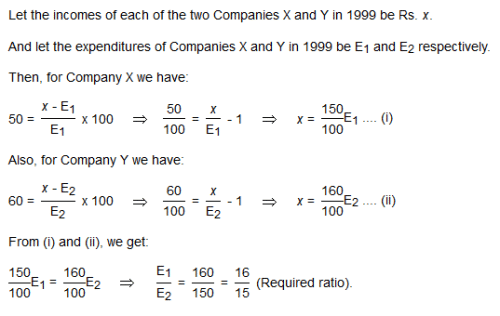
The following line graph gives the percent profit earned by two Companies X and Y during the period 1996 - 2001
If the incomes of two Comapanies were equal in 1999, then what was the ratio of expenditure of Company X to that of Company Y in 1999 ?


Important Questions for Line Charts- 4
Line Charts- 4 MCQs with Answers
Online Tests for Line Charts- 4
|
© EduRev
|
Education Revolution
|


|


