CAT Exam  >  CAT Tests  >  Arun Sharma Test: Pie Chart- 3 - CAT MCQ

Arun Sharma Test: Pie Chart- 3 - CAT MCQ


Test Description

5 Questions MCQ Test - Arun Sharma Test: Pie Chart- 3

Arun Sharma Test: Pie Chart- 3 for CAT 2024 is part of CAT preparation. The Arun Sharma Test: Pie Chart- 3 questions and answers have been prepared according to the CAT exam syllabus.The Arun Sharma Test: Pie Chart- 3 MCQs are made for CAT 2024 Exam. Find important definitions, questions, notes, meanings, examples, exercises, MCQs and online tests for Arun Sharma Test: Pie Chart- 3 below.
Solutions of Arun Sharma Test: Pie Chart- 3 questions in English are available as part of our course for CAT & Arun Sharma Test: Pie Chart- 3 solutions in Hindi for CAT course. Download more important topics, notes, lectures and mock test series for CAT Exam by signing up for free. Attempt Arun Sharma Test: Pie Chart- 3 | 5 questions in 7 minutes | Mock test for CAT preparation | Free important questions MCQ to study for CAT Exam | Download free PDF with solutions
Arun Sharma Test: Pie Chart- 3 - Question 1

The following pie chart shows the amount of subscriptions generated for India Bonds from different categories of investors.
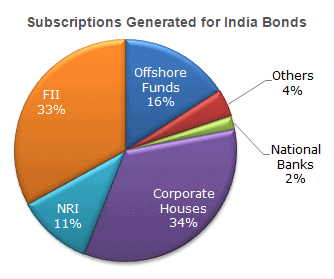
In the corporate sector, approximately how many degrees should be there in the central angle ?

Detailed Solution for Arun Sharma Test: Pie Chart- 3 - Question 1

34 x 3.6 = 122.4 (since 1% = 3.6 degrees)

Arun Sharma Test: Pie Chart- 3 - Question 2

The following pie chart shows the amount of subscriptions generated for India Bonds from different categories of investors

If the investment by NRI's are Rs 4,000 crore, then the investments by corporate houses and FII's together is:

Detailed Solution for Arun Sharma Test: Pie Chart- 3 - Question 2

(67/11) x 4000 = 24 363.6364

1 Crore+ students have signed up on EduRev. Have you? Download the App
Arun Sharma Test: Pie Chart- 3 - Question 3

The following pie chart shows the amount of subscriptions generated for India Bonds from different categories of investors.

What percentage of the total investment is coming from FII's and NRI's ?

Detailed Solution for Arun Sharma Test: Pie Chart- 3 - Question 3

(33 + 11) = 44

Arun Sharma Test: Pie Chart- 3 - Question 4

The following pie chart shows the amount of subscriptions generated for India Bonds from different categories of investors.

If the total investment other than by FII and corporate houses is Rs 335,000 crore, then the investment by NRI's and Offshore funds will be (approximately) ?

Detailed Solution for Arun Sharma Test: Pie Chart- 3 - Question 4

Investment other than NRI and corporate houses is 33% = 335000. Also, investment by offshore funds and NRI's is equal to 27%.

Hence, 27 x 335,000/33 = 274 090.909

Arun Sharma Test: Pie Chart- 3 - Question 5

The following pie chart shows the amount of subscriptions generated for India Bonds from different categories of investors.

If the total investment flows from FII's were to be doubled in the next year and the investment flows from all other sources had remained constant at their existing levels for this year, then what would be the proportion of FII investment in the total investment into India Bonds next year (in US $ millions) ?

Detailed Solution for Arun Sharma Test: Pie Chart- 3 - Question 5

FII's currently account for 33 out of 100.

If their value is doubled and all other investments are kept constant then their new value would be 66 out of 133 = approximately equal to 50%

Information about Arun Sharma Test: Pie Chart- 3 Page
In this test you can find the Exam questions for Arun Sharma Test: Pie Chart- 3 solved & explained in the simplest way possible. Besides giving Questions and answers for Arun Sharma Test: Pie Chart- 3, EduRev gives you an ample number of Online tests for practice

Top Courses for CAT

Download as PDF

Top Courses for CAT