Grade 7 Exam > Grade 7 Tests > Test: Data Handling - Grade 7 MCQ
Test: Data Handling - Grade 7 MCQ
Test Description
10 Questions MCQ Test - Test: Data Handling
Test: Data Handling for Grade 7 2025 is part of Grade 7 preparation. The Test: Data Handling questions and answers have been prepared
according to the Grade 7 exam syllabus.The Test: Data Handling MCQs are made for Grade 7 2025 Exam.
Find important definitions, questions, notes, meanings, examples, exercises, MCQs and online tests for Test: Data Handling below.
Solutions of Test: Data Handling questions in English are available as part of our course for Grade 7 & Test: Data Handling solutions in
Hindi for Grade 7 course.
Download more important topics, notes, lectures and mock test series for Grade 7 Exam by signing up for free. Attempt Test: Data Handling | 10 questions in 10 minutes | Mock test for Grade 7 preparation | Free important questions MCQ to study for Grade 7 Exam | Download free PDF with solutions
Test: Data Handling - Question 1
The number of times an observation occurs in a data is called its
Detailed Solution for Test: Data Handling - Question 1
Detailed Solution for Test: Data Handling - Question 2
Detailed Solution for Test: Data Handling - Question 3
Test: Data Handling - Question 4
The difference between the highest and lowest observation is called
Detailed Solution for Test: Data Handling - Question 4
Detailed Solution for Test: Data Handling - Question 5
Test: Data Handling - Question 6
Find the mean weight of the data set shown. 5 kg, 43 kg, 18 kg, 26 kg, 28 kg, 46 kg, 41 kg, 1 kg
Detailed Solution for Test: Data Handling - Question 6
Test: Data Handling - Question 7
A kennel can accommodate 12 dogs that weigh (in pounds) 6, 14, 23, 17, 19, 27, 39, 7, 33, 4, 11, and 13. Find the range of their weights.
Detailed Solution for Test: Data Handling - Question 7
Test: Data Handling - Question 8
Find the mode for the data set, which shows the heights (in inches) of 10 students of Piyush’s class. 65, 60, 64, 61, 66, 67, 67, 67, 62, 77
Detailed Solution for Test: Data Handling - Question 8
Detailed Solution for Test: Data Handling - Question 9
Test: Data Handling - Question 10
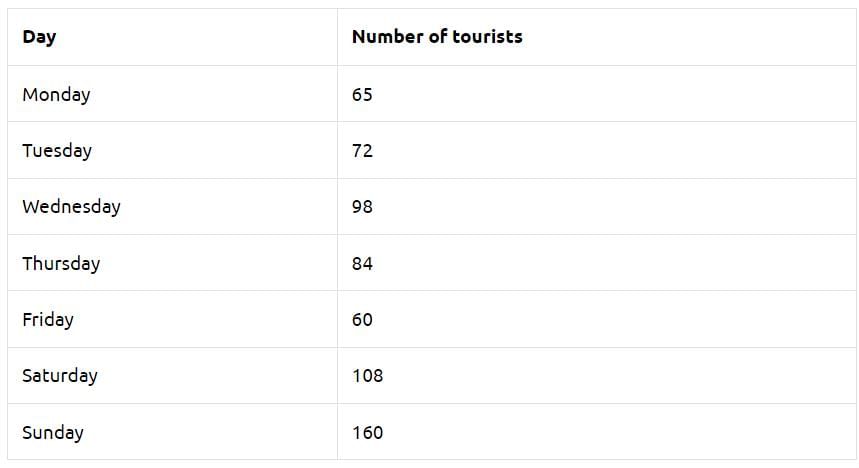
The number of tourists visiting a historical place in a week is shown in the following table:

The mean of the number of tourists visiting on all days is
Detailed Solution for Test: Data Handling - Question 10
Information about Test: Data Handling Page
In this test you can find the Exam questions for Test: Data Handling solved & explained in the simplest way possible.
Besides giving Questions and answers for Test: Data Handling, EduRev gives you an ample number of Online tests for practice
Download as PDF


