Olympiad Test: Data Handling - Class 7 MCQ
20 Questions MCQ Test - Olympiad Test: Data Handling

The table shows the number of hours Pavan studies on different days of a week.
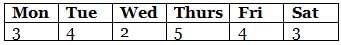
How many hours per day does he study on an average?
How many hours per day does he study on an average?
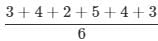
 hours
hoursFind the range of the data.
128,139,148,132,152,154,140,143,146,149,142
128,139,148,132,152,154,140,143,146,149,142

Direction: The bar graph shows the sales of fruits and vegetables in a store in 4 hours on a certain evening.
Sales of fruits and vegetables in a store
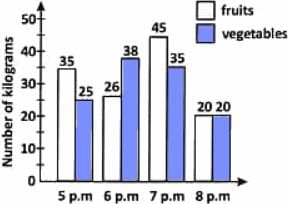
When was the sale of fruits lesser than that of vegetables?
Sales of fruits and vegetables in a store
When was the sale of fruits lesser than that of vegetables?
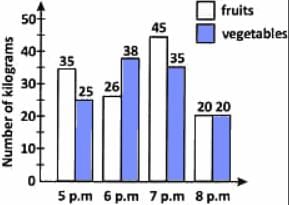
Direction: The bar graph shows the sales of fruits and vegetables in a store in 4 hours on a certain evening.
Sales of fruits and vegetables in a store
How many kilograms of fruits were sold during the four hours?
Direction: The bar graph shows the sales of fruits and vegetables in a store in 4 hours on a certain evening.
Sales of fruits and vegetables in a store
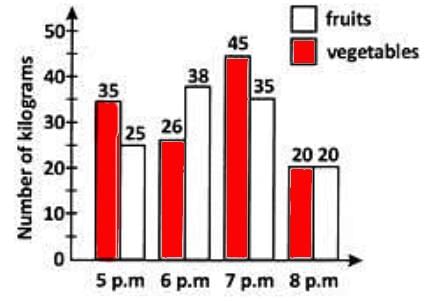
During the four hours, which of the following is true about the sale of fruits and vegetables?
Direction: The bargraph shows the marks obtained by four students in quarterly examination.

Whose performance was the best?
What is the arithmetic mean of first five prime numbers?
 = 5.6
= 5.6 Direction: The bargraph shows the marks obtained by four students in quarterly examination.
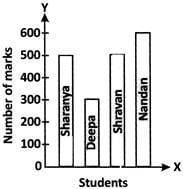
Whose performance was the worst?
Direction: The bargraph shows the marks obtained by four students in quarterly examination.

Which two students secured equal marks?
There are 2 red, 3 blue and 5 black balls in a bag. A ball is drawn from the bag without looking in to the bag. What is the probability of getting a red ball?
There are 2 red, 3 blue and 5 black balls in a bag. A ball is drawn from the bag without looking in to the bag. What is the probability of getting a blue ball?
There are 2 red, 3 blue and 5 black balls in a bag. A ball is drawn from the bag without looking in to the bag. What is the probability of getting a black ball?
There are 2 red, 3 blue and 5 black balls in a bag. A ball is drawn from the bag without looking in to the bag. What is the probability of getting a non-blue ball?
There are 2 red, 3 blue and 5 black balls in a bag. A ball is drawn from the bag without looking in to the bag. What is the probability of getting a non-black ball?
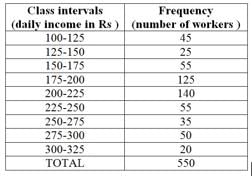
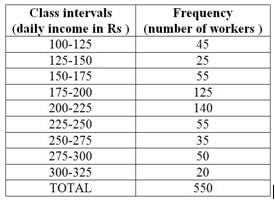
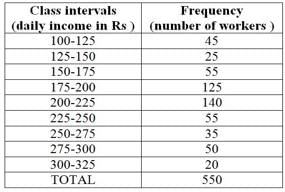
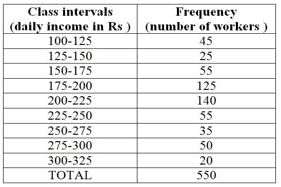
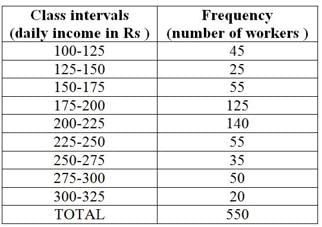
What is the upper limit of the class interval 250-275?
Important Questions for Olympiad Test: Data Handling
Olympiad Test: Data Handling MCQs with Answers
Online Tests for Olympiad Test: Data Handling
|
© EduRev
|
Education Revolution
|


|


within 7 days!