Test: Data Handling - Class 6 MCQ
10 Questions MCQ Test - Test: Data Handling

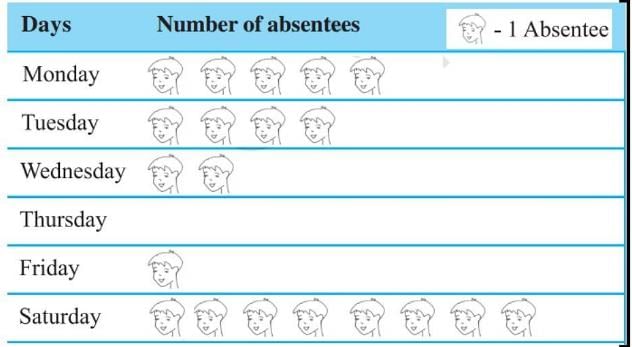
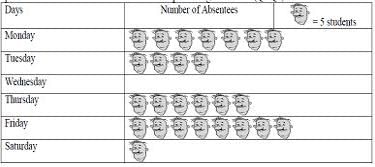
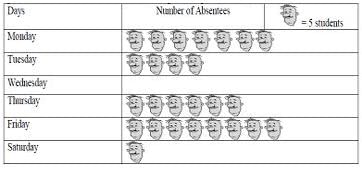
The following pictograph shows the number of absentees in a class of 30 students during the previous week. Which day had full attendance?
The following pictograph shows the number of absentees in a class of 40 students during the previous week. What was the total number of absentees on Tuesday?
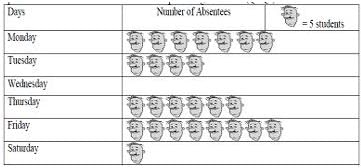

The following pictograph shows the number of absentees in a class of 40 students during the previous week. On which day 30 students were absent?
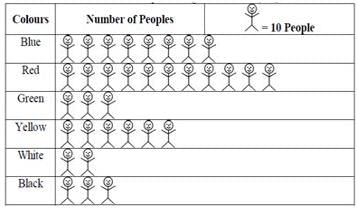
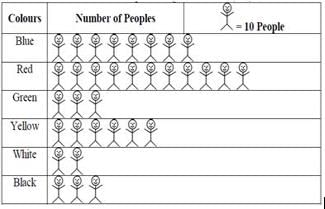
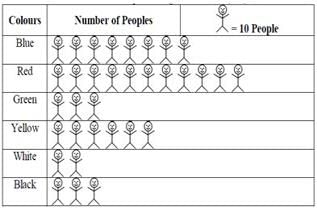
The colours of fridges preferred by people living in a locality are shown by the following pictograph. How many people liked red colour?
The following pictograph shows the number of absentees in a class of 40 students during the previous week. On which day were the maximum number of students absent?
The colours of fridges preferred by people living in a locality are shown by the following pictograph. Find the number of people preferring blue colour.
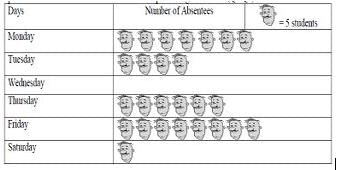
The following pictograph shows the number of absentees in a class of 50 students during the previous week. What was the total number of absentees in that week?
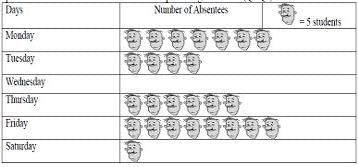
The following pictograph shows the number of absentees in a class of 60 students during the previous week. On which day 5 students were absent?
The colours of fridges preferred by people living in a locality are shown by the following pictograph. Which colour preferred most?
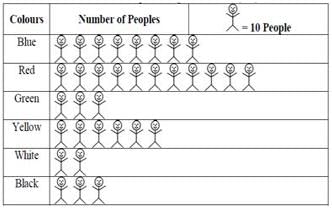
The colours of fridges preferred by people living in a locality are shown by the following pictograph. Which colour preferred least?


Important Questions for Data Handling
Data Handling MCQs with Answers
Online Tests for Data Handling
|
© EduRev
|
Education Revolution
|


|


