Test: Data Handling - 1 - Class 4 MCQ
10 Questions MCQ Test - Test: Data Handling - 1

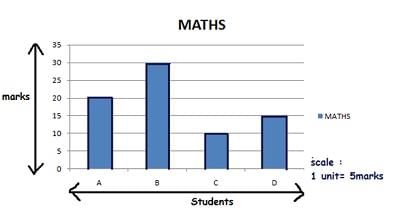
Directions: Given bar graph represents the number of students of different classes of a school who participated in a competition.
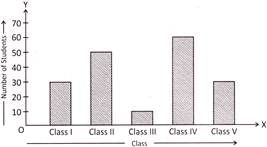
Study the bar graph and answer the question below:
How many students in total, of all five classes participated in the competition?

Direction: given line graph represents the number of people in a store since its opening till closing at various times of a day
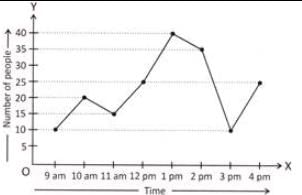
Study the line graph and answer the questions given below:
How many people were there at the store between 1 pm to 2 pm?
Study the line graph and answer the questions given below:
Directions: Given line graph represents the number of people in a store since its opening till closing at various times of a day.
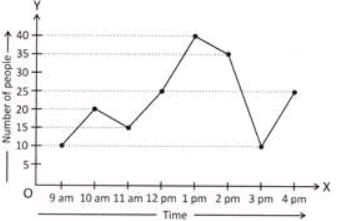
Study the line graph and answer the questions given below:
How many people were there in the store when it closed?
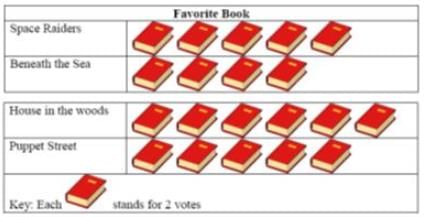
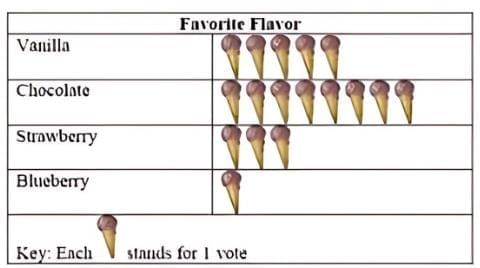
How many children in all voted for Space Raiders and Puppet Street?
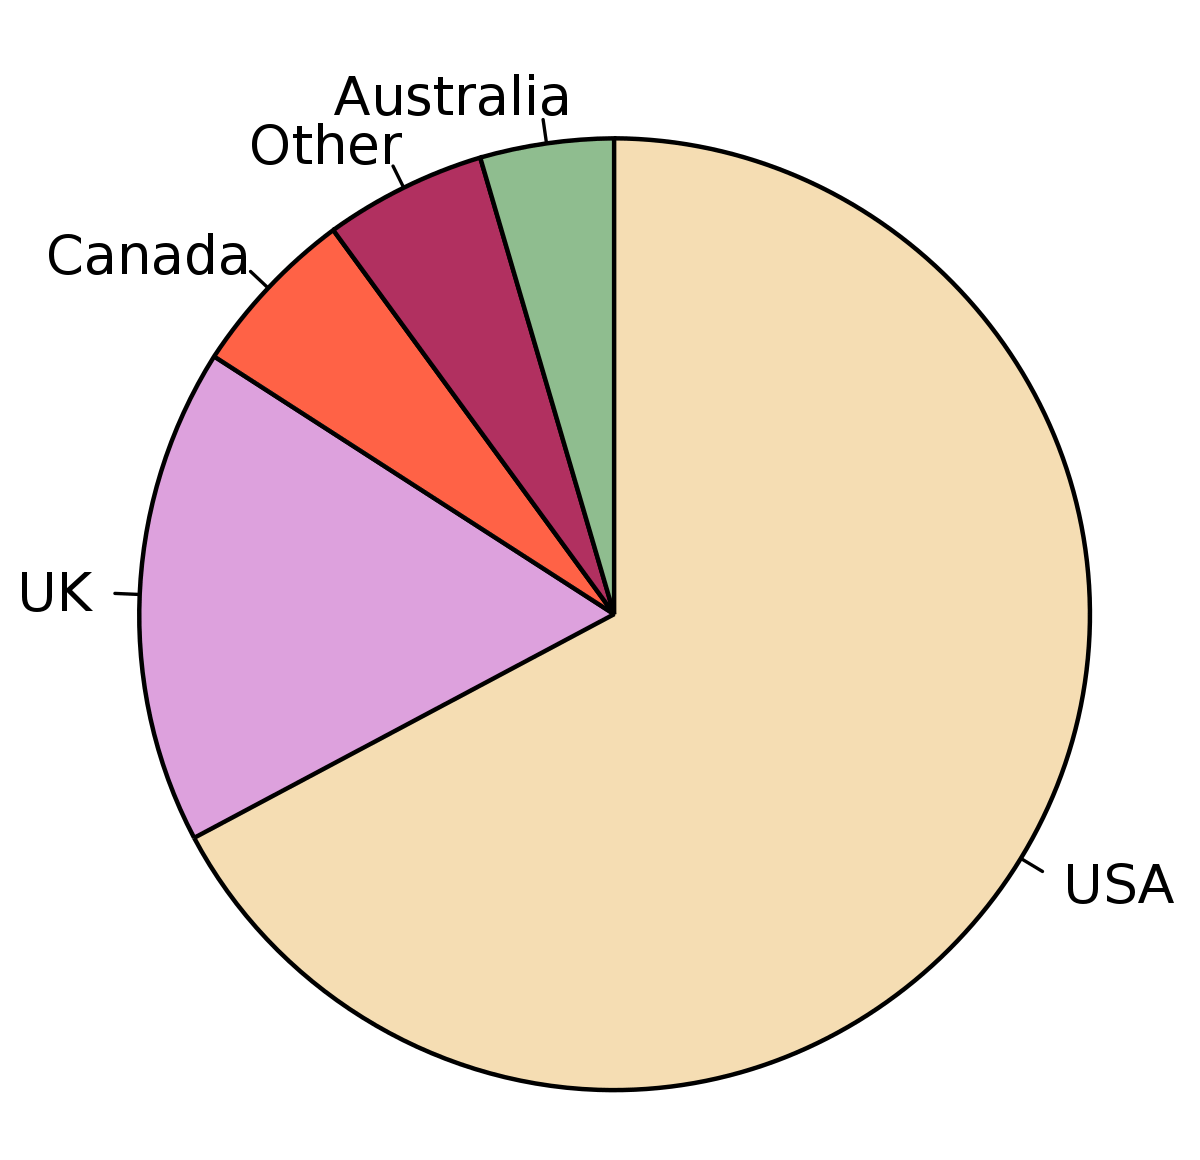
A graph in the shape of a circle to show relative sizes of data is called:
A _________ is a representation of numbers using bars of uniform widths.
Directions: Given line graph represents the number of people in a store since its opening till closing at various times of a day.
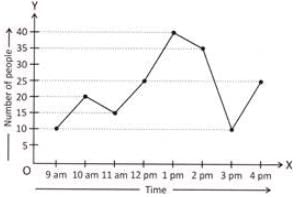
Study the line graph and answer the question given below:
How many people were there in the store when it opened?
Important Questions for Data Handling - 1
Data Handling - 1 MCQs with Answers
Online Tests for Data Handling - 1
|
© EduRev
|
Education Revolution
|


|


