Data Handling - 2 - Free MCQ Practice Test with solutions, Class 4 Mathematics
MCQ Practice Test & Solutions: Test: Data Handling - 2 (10 Questions)
You can prepare effectively for Class 4 Mathematics for Class 4 with this dedicated MCQ Practice Test (available with solutions) on the important topic of " Test: Data Handling - 2". These 10 questions have been designed by the experts with the latest curriculum of Class 4 2026, to help you master the concept.
Test Highlights:
- - Format: Multiple Choice Questions (MCQ)
- - Duration: 15 minutes
- - Number of Questions: 10
Sign up on EduRev for free to attempt this test and track your preparation progress.

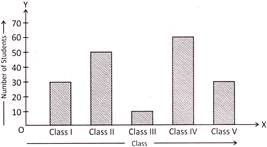
Directions: Given bar graph represents the number of students of different classes of a school who participated in a competition.

Study the bar graph and answer the questions below:
How many more students of class IV participated in the competition in comparison to class III?
Detailed Solution: Question 1
Detailed Solution: Question 2

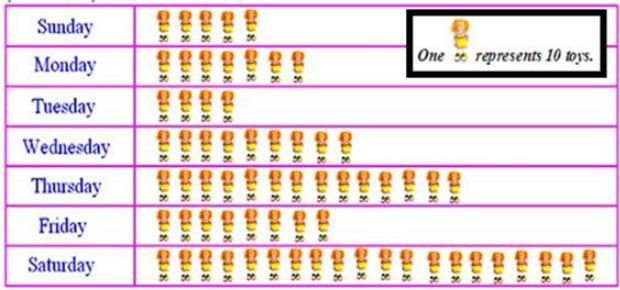
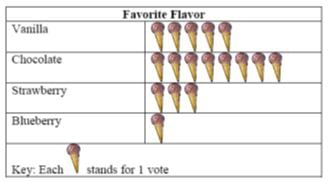
Given pictograph represent the different number of plants that were planted by the students of school in a particular week.
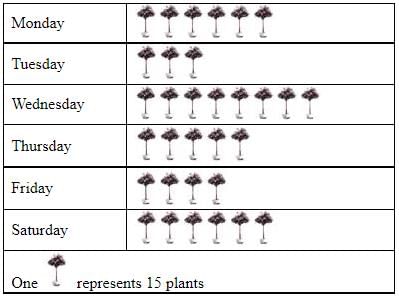
What is the difference between maximum and minimum number of plants that were planted on two days in the week?
Detailed Solution: Question 3
The ages in years of 10 teachers of a school are: 32, 41, 28, 54, 35, 26, 23, 33, 38, 40. What is the age of the youngest teacher?
Detailed Solution: Question 4
Directions: Given line graph represents the number of people in a store since its opening till closing at various times of a day.
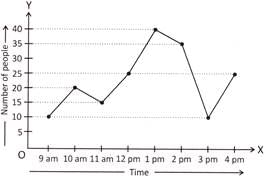
Study the line graph and answer the questions given below:
What was the busiest time of the day at the store?
Detailed Solution: Question 5
Detailed Solution: Question 6
Detailed Solution: Question 7
Directions: Given bar graph represents the number of students of different classes of a school who participated in a competition.
Study the bar graph and answer the questions below:
How many students of class II and class V altogether participated in the competition?
Detailed Solution: Question 8
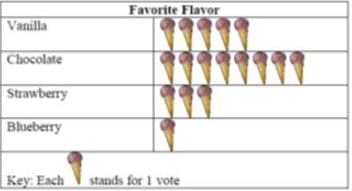
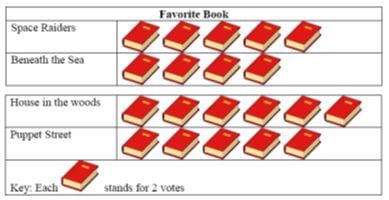
How many more children voted for Puppet Street than voted for Beneath the Sea?
Detailed Solution: Question 9
Given pie chart represents the number of books on different subjects sold by a book seller.
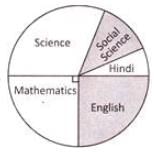
Of which two subjects, the books sold by the book seller were equal in number?
Detailed Solution: Question 10
35 videos|168 docs|30 tests |