Class 8 Exam  >  Class 8 Tests  >  Test: Data Handling- 2 - Class 8 MCQ

Test: Data Handling- 2 - Class 8 MCQ


Test Description

20 Questions MCQ Test - Test: Data Handling- 2

Test: Data Handling- 2 for Class 8 2024 is part of Class 8 preparation. The Test: Data Handling- 2 questions and answers have been prepared according to the Class 8 exam syllabus.The Test: Data Handling- 2 MCQs are made for Class 8 2024 Exam. Find important definitions, questions, notes, meanings, examples, exercises, MCQs and online tests for Test: Data Handling- 2 below.
Solutions of Test: Data Handling- 2 questions in English are available as part of our course for Class 8 & Test: Data Handling- 2 solutions in Hindi for Class 8 course. Download more important topics, notes, lectures and mock test series for Class 8 Exam by signing up for free. Attempt Test: Data Handling- 2 | 20 questions in 20 minutes | Mock test for Class 8 preparation | Free important questions MCQ to study for Class 8 Exam | Download free PDF with solutions
Test: Data Handling- 2 - Question 1

What is the upper limit of the class interval 30 – 40?

Detailed Solution for Test: Data Handling- 2 - Question 1

Upper limit is the highest number of the interval. Hence upper limit is 40 in the interval 30-40.

Test: Data Handling- 2 - Question 2

Which class has the lowest frequency?

1 Crore+ students have signed up on EduRev. Have you? Download the App
Test: Data Handling- 2 - Question 3

What is the size of the class interval?

Detailed Solution for Test: Data Handling- 2 - Question 3

Class interval refers to the numerical width of any class in a particular distribution. It is defined as the difference between the upper-class limit and the lower class limit. Class Interval = Upper-Class limit – Lower class limit.

Test: Data Handling- 2 - Question 4

Which two classes have the same frequency?

Test: Data Handling- 2 - Question 5

What is the lower limit of the class interval 40 – 50?

Detailed Solution for Test: Data Handling- 2 - Question 5

Lower limit is the least number of the interval. Hence 40 is the lowest limit.

Test: Data Handling- 2 - Question 6

Which class has the highest frequency?

Detailed Solution for Test: Data Handling- 2 - Question 6

Answer is B because it is asking Highest frequency and the highest frequency is 20 - 30 

Test: Data Handling- 2 - Question 7

When a die is thrown, total number of possible outcomes is ______.

Detailed Solution for Test: Data Handling- 2 - Question 7

When a die is thrown, the total number of possible outcomes is:


  • Each face of a standard die is numbered from 1 to 6.
  • When you throw the die, it can land on any one of these six faces.
  • This means there are six different possible outcomes.

So, the correct answer is:
A: 6

Test: Data Handling- 2 - Question 8

When a coin is thrown, total number of possible outcomes is ______.

Test: Data Handling- 2 - Question 9

Two dice are thrown, find and number of outcomes.

Detailed Solution for Test: Data Handling- 2 - Question 9

We know that in a single thrown of two die, the total number of possible outcomes is (6 × 6) = 36. Let S be the sample space. Then, n(S) = 36
 

When two dice are thrown, each die has 6 faces, numbered from 1 to 6. To find the total number of outcomes when both dice are thrown, you can use the multiplication principle.

  1. Outcomes for the first die: There are 6 possible outcomes (1, 2, 3, 4, 5, 6).
  2. Outcomes for the second die: Similarly, there are also 6 possible outcomes.

To find the total number of outcomes when both dice are thrown, multiply the number of outcomes for the first die by the number of outcomes for the second die:

Total Outcomes=Outcomes for the first die×Outcomes for the second die=6×6=36\text{Total Outcomes} = \text{Outcomes for the first die} \times \text{Outcomes for the second die} = 6 \times 6 = 36Total Outcomes=Outcomes for the first die×Outcomes for the second die=6×6=36

Conclusion

So, when two dice are thrown, there are a total of 36 possible outcomes. Each outcome can be represented as an ordered pair (x, y), where x is the result from the first die and y is the result from the second die. For example, (1, 1), (1, 2), ..., (6, 6).

Test: Data Handling- 2 - Question 10

There are 2 Red, 3 Blue and 5 Black balls in a bag. A ball is drawn from the bag without looking in to the bag. What is the probability of getting a non-red ball?

Detailed Solution for Test: Data Handling- 2 - Question 10

Non - red ball = 8
Probability = No of non red balls/Total no. of outcomes
= 8/10 = 4/5

Test: Data Handling- 2 - Question 11

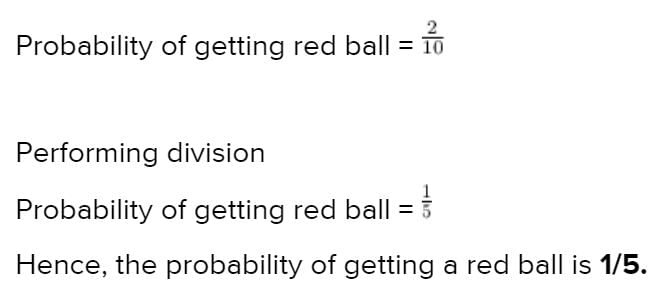
There are 2 Red, 3 Blue and 5 Black balls in a bag. A ball is drawn from the bag without looking in to the bag. What is the probability of getting a red ball?

Detailed Solution for Test: Data Handling- 2 - Question 11

Given - Number of different balls
Find - Probability of getting red ball
Solution - Probability of getting red ball = number of red balls / total number of balls.
Number of red balls = 2
Total number of balls = 2 + 3 + 5
Performing addition
Total number of balls = 10
Keep the values in formula to find the probability of getting red ball.

Test: Data Handling- 2 - Question 12

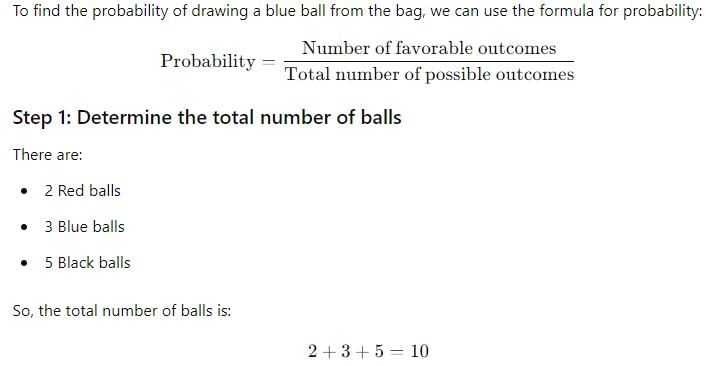
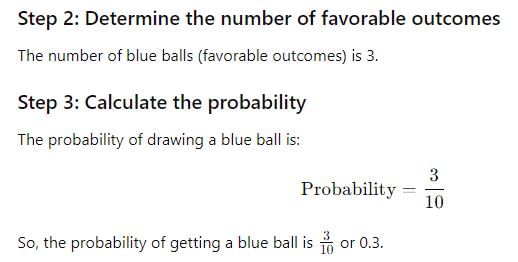
There are 2 Red, 3 Blue and 5 Black balls in a bag. A ball is drawn from the bag without looking in to the bag. What is the probability of getting a blue ball?

Detailed Solution for Test: Data Handling- 2 - Question 12

Test: Data Handling- 2 - Question 13

There are 2 Red, 3 Blue and 5 Black balls in a bag. A ball is drawn from the bag without looking in to the bag. What is the probability of getting a black ball?

Detailed Solution for Test: Data Handling- 2 - Question 13

total no of black ball / total no of balls
5 / 10 
1 / 2

Test: Data Handling- 2 - Question 14

There are 2 Red, 3 Blue and 5 Black balls in a bag. A ball is drawn from the bag without looking in to the bag. What is the probability of getting a non-black ball?

Test: Data Handling- 2 - Question 15

There are 2 Red, 3 Blue and 5 Black balls in a bag. A ball is drawn from the bag without looking in to the bag. What is the probability of getting a non-blue ball?

Detailed Solution for Test: Data Handling- 2 - Question 15

Total out comes are=2+3+5=10

So, Probability of getting a non blue ball is = 7/10

Test: Data Handling- 2 - Question 16

What is the size of class intervals?

Detailed Solution for Test: Data Handling- 2 - Question 16

just subtract lower limit from upper limit
150 - 125 = 25

Test: Data Handling- 2 - Question 17

Which class has the highest frequency?

Test: Data Handling- 2 - Question 18

Which class has the lowest frequency?

Test: Data Handling- 2 - Question 19

What is the frequency of class interval 300-325?

Detailed Solution for Test: Data Handling- 2 - Question 19

clearly for class 300-325  frequency is 20

Test: Data Handling- 2 - Question 20

Study the following frequency distribution table and answer the questions given below.  
Q. What is the upper limit of the class interval 250-275?

Detailed Solution for Test: Data Handling- 2 - Question 20

Correct answer is C. 275

Information about Test: Data Handling- 2 Page
In this test you can find the Exam questions for Test: Data Handling- 2 solved & explained in the simplest way possible. Besides giving Questions and answers for Test: Data Handling- 2, EduRev gives you an ample number of Online tests for practice

Top Courses for Class 8

Download as PDF

Top Courses for Class 8