Test Level 1: Bar Graph - CAT MCQ
20 Questions MCQ Test - Test Level 1: Bar Graph

Directions: The following graph shows the performance of FANTASTIC Ltd. over the given years. Refer to the graph to answer the question that follows.
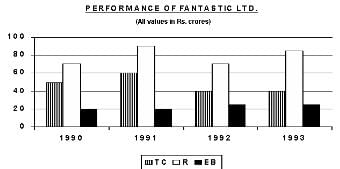
Total Cost(TC) = Raw Material Cost + Labour Cost + Interest Cost
Profit = Revenue (R) - Total CostT (TC)
Shareholders Satisfaction = (Revenue - Total Cost)/Equity Base (EB)
Q. If the raw material, labour and interest costs for 1991 were in the ratio 7 : 2 : 3, then the raw material cost for 1991 was (in Rs. crore)
Profit = Revenue (R) - Total CostT (TC)
Shareholders Satisfaction = (Revenue - Total Cost)/Equity Base (EB)
Directions: Study the given bar graph and answer the following question.
The bar graph below shows the sales (in Rs. 000) of clothes in different regions during different quarters of a year:
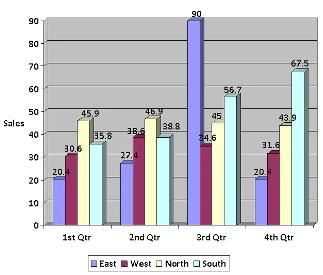
Q. What were the average sales (in Rs. 000) during the second quarter?
The bar graph below shows the sales (in Rs. 000) of clothes in different regions during different quarters of a year:

Directions: Study the given data and answer the following question.
Sales of two companies A and B over 12 months:
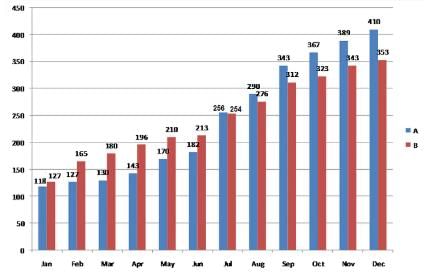
Q. Which company has more sales?
Directions: Study the given data and answer the following question.
Sales of two companies A and B over 12 months:

Q. During which quarter were the sales of company A maximum?
Directions: Answer the question based on the following bar graph.
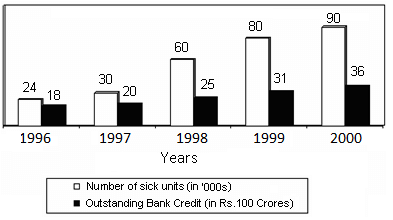
Q. If the bank credit were reduced to half in the year 1997, then what would be the approximate outstanding bank credit per sick unit?
Directions: Answer the question based on the following bar graph.

Q. What was the percentage increase in number of sick units from 1997 to 1999?
Directions: Study the given bar graph and answer the following question.
Number of engineering students (in hundreds) at different institutions in different years:

Q. What was the total number of engineering students in 1989-90?
Directions: Study the given bar graph and answer the following question.
Number of engineering students (in hundreds) at different institutions in different years:
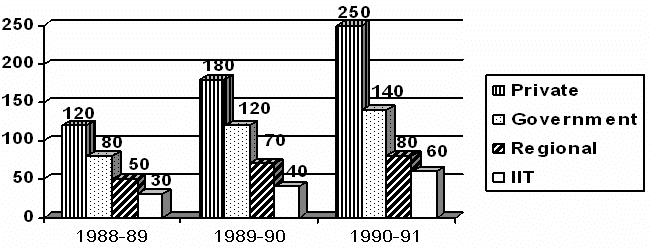
Q. The total number of engineering students in 1991-92, assuming a 10% reduction in the number over the previous year, was
Directions: Study the given information and answer the following question.
The bar chart given below shows the production of different dress materials (in hundreds) from 6 cities during the years 2015 and 2016.

Q. The average production of dress materials in cities A, B and C in 2016 is what percentage of average production of dress materials in cities D, E and F in 2015 (in approximation)?
 × 100 = 121.73%
Directions: Study the given bar graph and answer the following question.
The bar graph below shows the sales (in Rs. 000) of clothes in different regions during different quarters of a year:

Q. What is the approximate average sale of all regions in the first quarter (in 000's)?
 (in 000's)
Directions: Study the given bar graph and answer the following question.
The bar graph below shows the sales (in Rs. 000) of clothes in different regions during different quarters of a year:
Q. What was the range of sales (in Rs. 000) over the four quarters in the east region?
Directions: Study the given data and answer the following question.
Sales of two companies A and B over 12 months:
Q. What was the percentage increase in sales of company A from March to April?
Directions: Answer the question based on the following bar graph.

Q. What was the difference between outstanding bank credits in 1997 and 1998?
Directions: Answer the question based on the following bar graph.

Q. In 1999, what was the approximate average outstanding bank credit per sick unit?
Directions: Study the given bar graph and answer the following question.
Number of engineering students (in hundreds) at different institutions in different years:

Q. The growth rate of the number of students in government engineering colleges compared to that in private engineering colleges between 1988-89 and 1989-90 was

 100
100
 100 = 50%
Directions: Study the given information and answer the following question.
The bar chart given below shows the production of different dress materials (in hundreds) from 6 cities during the years 2015 and 2016.
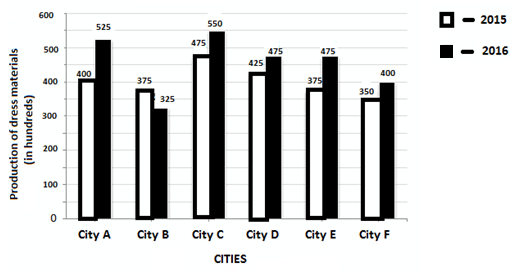
Q. What is the difference between the total production of dress materials in cities A, C and E together, and the total production of dress materials in cities B, D and F for the year 2016?
Directions: Study the given information and answer the following question.
The bar chart given below shows the production of different dress materials (in hundreds) from 6 cities during the years 2015 and 2016.

Q. The total production of dress materials in City E and City F for the year 2015 is what percent of the total production of dress materials in City C and City D for the same year?

 100 = 80.55%
Directions: Answer the question based on the information given below.
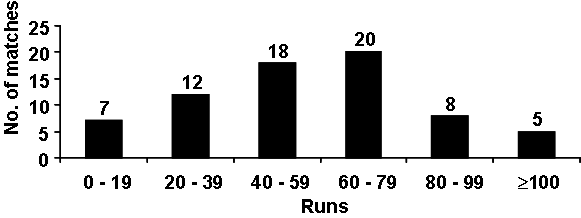
The following chart shows the runs scored by Dravid in the year 2006-07.
Best = Highest score in any match
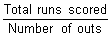
Average = Total runs scored/Number of outs
Q. If Dravid was out in all the innings he played, what is the minimum possible average can he have? (If his best is 118)
 0 + 12
  20 + 18
  40 + 20
  60 + 8
  80 + 4
  100 + 118 = 3318.
Directions: Answer the question based on the information given below.
The following chart shows the runs scored by Dravid in the year 2006-07.

Best = Highest score in any match
Average = Total runs scored/Number of outs
 , it will become maximum if total runs scored is maximum.
 19 + 12
  39 + 18
  59 + 20
  79 + 8
  99 + 5
  120 = 4635 (Since best is 120).
Directions: Study the given graph carefully and answer the following question.
The graph below shows the numbers of students appearing for and qualifying in a scholarship exam from various schools:
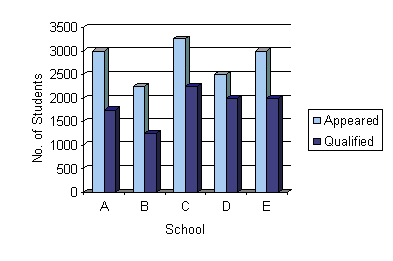
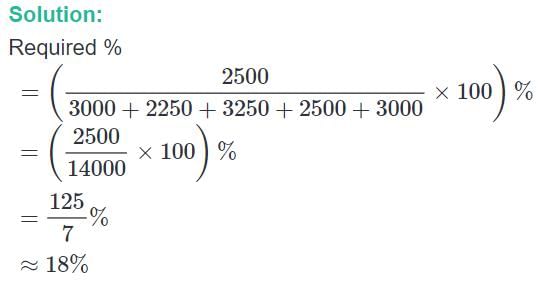
The number of students appeared for the scholarship exam from School D is approximately what percent of the total number of students appeared for the exam from all the school together?


Important Questions for Test Level 1: Bar Graph
Test Level 1: Bar Graph MCQs with Answers
Online Tests for Test Level 1: Bar Graph
|
© EduRev
|
Education Revolution
|


|


