Test Level 3: Missing Data - CAT MCQ
10 Questions MCQ Test - Test Level 3: Missing Data

Directions: Read the following to answer the question.
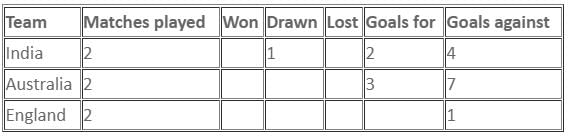
The following table shows the results of Triangular Hockey Series played among the teams of India, Australia and England. The matches were played in such a manner that each team played against another at least once. The table has a few missing pieces of information.

Q. Calculate the total number of matches played in the whole series.
Directions: Read the following to answer the question.
The following table shows the results of Triangular Hockey Series played among the teams of India, Australia and England. The matches were played in such a manner that each team played against another at least once. The table has a few missing pieces of information.
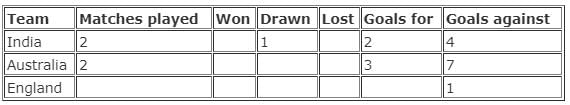
Q. Identify the score card reading during India-England match, favouring India.

Directions: Read the following to answer the question.
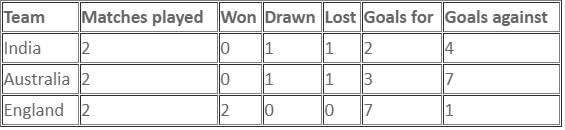
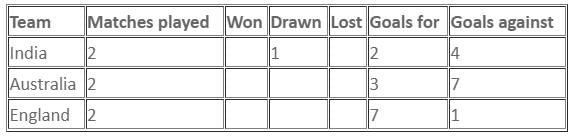
The following table shows the results of Triangular Hockey Series played among the teams of India, Australia and England. The matches were played in such a manner that each team played against another at least once. The table has a few missing pieces of information.

Q. What is the mean average of goals scored by all three teams in the whole series?
Directions: Read the data and answer the following question.
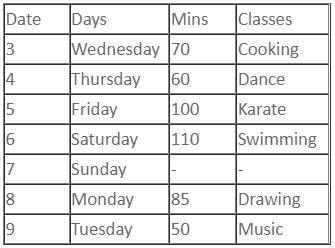
Dance, music, cooking, karate, swimming and drawing classes are to be scheduled from 3rd April to 9th April, not necessarily in the same order. Each of them is held for 50 mins, 60 mins, 70 mins, 85 mins, 100 mins and 110 mins, but not necessarily in the same order. A class of 50 mins is scheduled on 9th April which is not Sunday as it is an off day. Dance class is for less than 70 mins and is scheduled immediately before karate class. There are two classes scheduled between swimming class, which is for 110 mins and cooking class, which is for 70 mins. Karate class is before Sunday and there are two days between Sunday and the dance class. Drawing class, which is for 85 mins, is not scheduled on 3rd April. Saturday's class is of 110 mins.
Q. On which of the following days is the drawing class scheduled?

Directions: Read the data and answer the following question.
Dance, music, cooking, karate, swimming and drawing classes are to be scheduled from 3rd April to 9th April, not necessarily in the same order. Each of them is held for 50 mins, 60 mins, 70 mins, 85 mins, 100 mins and 110 mins, but not necessarily in the same order. A class of 50 mins is scheduled on 9th April which is not Sunday as it is an off day. Dance class is for less than 70 mins and is scheduled immediately before karate class. There are two classes scheduled between swimming class, which is for 110 mins and cooking class, which is for 70 mins. Karate class is before Sunday and there are two days between Sunday and the dance class. Drawing class, which is for 85 mins, is not scheduled on 3rd April. Saturday's class is of 110 mins.
Q. Which of the following is correct?
Directions: Read the data and answer the following question.
Dance, music, cooking, karate, swimming and drawing classes are to be scheduled from 3rd April to 9th April, not necessarily in the same order. Each of them is held for 50 mins, 60 mins, 70 mins, 85 mins, 100 mins and 110 mins, but not necessarily in the same order. A class of 50 mins is scheduled on 9th April which is not Sunday as it is an off day. Dance class is for less than 70 mins and is scheduled immediately before karate class. There are two classes scheduled between swimming class, which is for 110 mins and cooking class, which is for 70 mins. Karate class is before Sunday and there are two days between Sunday and the dance class. Drawing class, which is for 85 mins, is not scheduled on 3rd April. Saturday's class is of 110 mins.
Q. Wednesday is on

Directions: Study the table carefully and answer the given question.
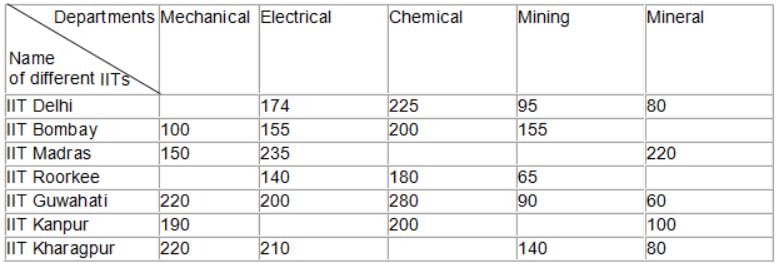
The following table shows the number of students in different engineering departments at seven IITs. Some of the data is missing from the table.

The above table is given for year 2014. In 2015, the intake of Mechanical Engineering at all the IITs together was increased by 10%, intake of Mineral Engineering was increased by 10% and intake of Chemical Engineering was increased by 8%. The intake of other departments remained the same as that of previous year.
Q. In 2014, all the students (in case total number of students was 55 or less) or only top 55 students from every department at each IIT received a scholarship of Rs. 2000. Out of the remaining, all the students (in case number of remaining students was 45 or less) or only the next 45 students from every department at each IIT received a scholarship of Rs. 1200. What is the total amount of scholarship awarded to students studying in Mining Engineering department at all the IITs together in 2014, if the total number of students in Mining Engineering at all the IITs together in 2015 was 600?
Directions: Study the table carefully and answer the given question.
The following table shows the number of students in different engineering departments at seven IITs. Some of the data is missing from the table.
The above table is given for year 2014. In 2015, the intake of Mechanical Engineering at all the IITs together was increased by 10%, intake of Mineral Engineering was increased by 10% and intake of Chemical Engineering was increased by 8%. The intake of other departments remained the same as that of previous year.
Q. What was the ratio of the total number of students in Mechanical Engineering at IIT Delhi and IIT Roorkee in 2014, if the total number of students in Mechanical Engineering at all the IITs in 2014 was 50% more than the total number of students at IIT Delhi in 2015 and IIT Delhi had 29 students more in Mechanical Engineering as compared to Mechanical students at IIT Roorkee in 2014?
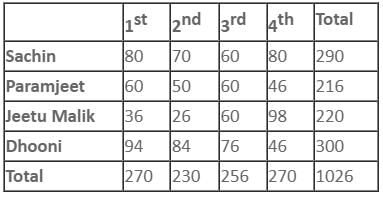
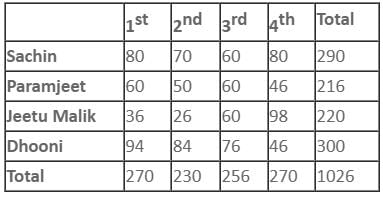
Directions: The following table shows some incomplete information about the runs scored by four batsmen in four innings.

Additional information:
1. Average runs scored in the 1st innings for all the players were 67.5.
2. Paramjeet's average runs for all 4 innings were 1.5 times the runs scored by Jeetu in 1st innings.
3. Sachin's average runs were 72.5 in all four innings.
4. Total runs scored by Dhooni in all the four innings were 300.
5. The runs scored in 2nd innings were 10 less than the runs scored in 1st innings for all the players.
6. Paramjeet and Dhooni scored the same runs in 4th innings.
7. Sum of runs scored by all the players in the 4th innings is 270.
Q. Who scored the least in the 2nd innings?
Directions: The following table shows some incomplete information about the runs scored by four batsmen in four innings.
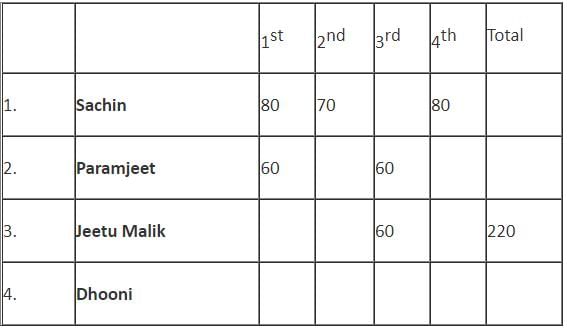
Additional information:
1. Average runs scored in the 1st innings for all the players were 67.5.
2. Paramjeet's average runs for all 4 innings were 1.5 times the runs scored by Jeetu in 1st innings.
3. Sachin's average runs were 72.5 in all four innings.
4. Total runs scored by Dhooni in all the four innings were 300.
5. The runs scored in 2nd innings were 10 less than the runs scored in 1st innings for all the players.
6. Paramjeet and Dhooni scored the same runs in 4th innings.
7. Sum of runs scored by all the players in the 4th innings is 270.
Q. Who scored the lowest runs in the 1st innings?


Important Questions for Test Level 3: Missing Data
Test Level 3: Missing Data MCQs with Answers
Online Tests for Test Level 3: Missing Data
|
© EduRev
|
Education Revolution
|


|


