Electrical Engineering (EE) Exam  >  Electrical Engineering (EE) Tests  >  Test: Bode Plot - 3 - Electrical Engineering (EE) MCQ

Test: Bode Plot - 3 - Electrical Engineering (EE) MCQ


Test Description

10 Questions MCQ Test - Test: Bode Plot - 3

Test: Bode Plot - 3 for Electrical Engineering (EE) 2024 is part of Electrical Engineering (EE) preparation. The Test: Bode Plot - 3 questions and answers have been prepared according to the Electrical Engineering (EE) exam syllabus.The Test: Bode Plot - 3 MCQs are made for Electrical Engineering (EE) 2024 Exam. Find important definitions, questions, notes, meanings, examples, exercises, MCQs and online tests for Test: Bode Plot - 3 below.
Solutions of Test: Bode Plot - 3 questions in English are available as part of our course for Electrical Engineering (EE) & Test: Bode Plot - 3 solutions in Hindi for Electrical Engineering (EE) course. Download more important topics, notes, lectures and mock test series for Electrical Engineering (EE) Exam by signing up for free. Attempt Test: Bode Plot - 3 | 10 questions in 30 minutes | Mock test for Electrical Engineering (EE) preparation | Free important questions MCQ to study for Electrical Engineering (EE) Exam | Download free PDF with solutions
*Answer can only contain numeric values
Test: Bode Plot - 3 - Question 1

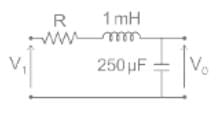
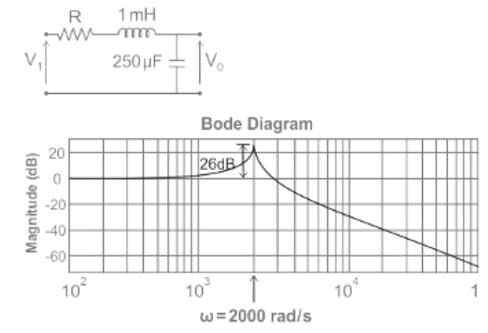
The bode magnitude plot for the transfer function V0(s)/Vi(s) of the circuit is as shown. The value of R is ______ Ω.(Round off to 2 decimal places.)

Detailed Solution for Test: Bode Plot - 3 - Question 1

Given circuit,

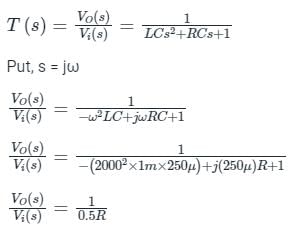
The transfer function for series RLC circuit by taking output voltage acroos the capacitor is given by,

From the plot,
20 log|Mr| = 26 dB
|Mr| = 19.95
19.95 × 0.5R = 1
R = 0.1 Ω

*Answer can only contain numeric values
Test: Bode Plot - 3 - Question 2

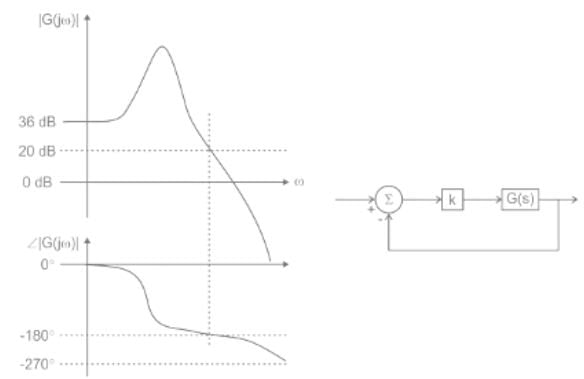
The figure below shows the Bode magnitude and phase plots of a stable transfer function


Consider the negative unity feedback configuration with gain in the feedforward path. The closed loop is stable for k < k0. The maximum value of k0 is ______.

Detailed Solution for Test: Bode Plot - 3 - Question 2

According to figure
Gain = 20 dB (at phase cross over frequency)
Gian margin = -20 dB
System make to marginally stable G.M = 0 or Gain = 0 dB
i.e 20 log K = -20
log K = -1
K = 10-1 = 0.1
So for K < 0.1 system will be stable

1 Crore+ students have signed up on EduRev. Have you? Download the App
*Answer can only contain numeric values
Test: Bode Plot - 3 - Question 3

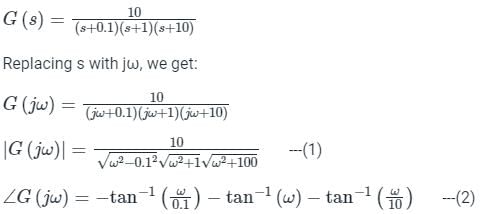
Phase margin in degree of G(s) =  Using asymptotic Bode plot is _____


Detailed Solution for Test: Bode Plot - 3 - Question 3

Phase margin = 180° + ∠GH(jω) at ω = ωgc
ωgc = Gain cross over frequency

ωgc: Gain crossover frequency: It is defined as the frequency at which the gain of the system is unity.
Now, see the magnitude expression (1) of the system, it looks very complicated to calculate ωgc. Here comes, the role of the Bode plot.
Points to Remember:
Before drawing the Bode plot, always convert the transfer function into its time constant form.
Pole-zero form:

Time-constant form:

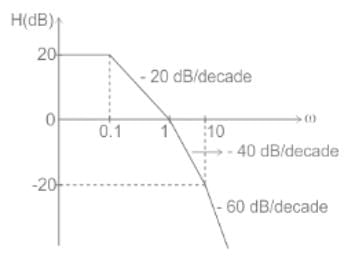
Bode plot:

Poles are at s = -0.1, -1 and -10
Initially, since it is a type zero system, the slope of the Bode plot is 0 dB/decade.
Magnitude, M = 20 log10 k dB
M = 20 log10 10 = 20 dB

From Bode plot magnitude is 0 dB at ω = 1
0 dB = 20 log10 M
M = 1 at ω = 1
Hence ωgc = 1

At ω = ωgc = 1, we get:

= - 45° - 84.289 – 5.710 = -135°  
Phase margin, PM = 180° + ∠GH(jω)  at ω = ωgc
PM = 180° - 135°
PM = 45°

*Answer can only contain numeric values
Test: Bode Plot - 3 - Question 4

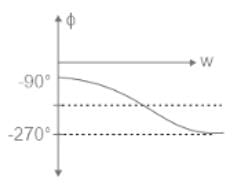
For the system having open loop transfer function. Bode phase plote is shown below. What is the value of 'N'

Detailed Solution for Test: Bode Plot - 3 - Question 4

The phase of the system is given by 
ϕ = (-90º)N- tan-1(w/1) - tan-1(w/10)
at w = 0
we can see in the graph we have -90º
∴ -90º = (-90º)N- 0 - 0
∴ N = 1

Test: Bode Plot - 3 - Question 5

An op-amp based programmable gain amplifier with a negative feedback is designed. Which method will be the best suitable for the stability analysis?

Detailed Solution for Test: Bode Plot - 3 - Question 5

Stability can be determined easily from a plot of the loop gain versus frequency.
The critical point is when the loop gain equals 0 dB (gain equals 1) because a circuit must have gain ≥ 1 to become unstable.
The phase margin, which is the difference between the measured phase angle and 180º, is calculated at the 0-dB point.
Bode plot is the plot of loop gain versus frequency.
Using Bode Plot we can easily find the gain margin and phase margin of the system.
We can also see the effect of resistor or capacitance on the Bode plot by analyzing the Bode plot.
We can get different parameters like Bandwidth, the cutoff frequency of op-amp by bode plot So the Bode plot is the best suitable for stability analysis.

Test: Bode Plot - 3 - Question 6

A unity feedback system has a transfer function -

Find its gain margin.

Detailed Solution for Test: Bode Plot - 3 - Question 6

Concept:
The gain margin is always calculated at the phase Crossover frequency (ωpc)
The phase Crossover frequency (ωpc) is calculated as:

Calculation:
Given:

The phase Crossover frequency (ωpc) is calculated as:

On solving we'll get:

Test: Bode Plot - 3 - Question 7

For an LTI system, the Bode plot for its gain is as illustrated in the figure shown. The number of system poles Np and the number of system zeros Nz in the frequency range 1 Hz ≤ f ≤ 107 Hz is

Detailed Solution for Test: Bode Plot - 3 - Question 7

Concept:

  • The slope of the bode plot decreases by 20 dB/decade at the pole
  • The slope of the bode plot increases by 20 dB/decade at zero

Application:

Total poles: 6 = NP
Total zeros: 3 = NZ

Test: Bode Plot - 3 - Question 8

The forward path transfer function L(s) of the control system shown in Figure (a) has the asymptotic Bode plot shown in Figure (b). If the disturbance d(t) is given by d (t) 0.1sin(ωt) where ω = 5 rad/s, the steady-state amplitude of the output y(t) is

Detailed Solution for Test: Bode Plot - 3 - Question 8

d(t) = 0.1 sin (ωt)

as r = 0
y = - y L(s) + d
⇒ y = d/1+L(s)
From bode magnitude plot
At ω = 5 rad/sec, magnitude of L(s) = 40 dB
⇒ magnitude of L(s) = 100
From Bode phase plot
∠L(s) = 120° at ω = 5 rad/sec
L(s) at 5 rad/sec = 100 ∠-120°

⇒ |y| = 1 x 10⁻³

Test: Bode Plot - 3 - Question 9

Consider the following asymptotic Bode magnitude plot (ω is in rad/s).

Which one of the following transfer functions is best represented by the above Bode magnitude plot?

Detailed Solution for Test: Bode Plot - 3 - Question 9


Here starting slope is +20 db/dec
Hence s1 is at numerator part of T.F.
Now from the straight line equation y = mx + c, we get
0 = 20 log (0.5) + c
∴ c = 6.0205
Now c = 20 log K
6.0205 = 20 log K
K = 2
We can find the value of ω1 as
12 = 20 log (ω1) + 6.0205
ω1 = 1.99 ≈ 2
Now we have to find ω2,  so that
0 = - 40 log (8) + c
c = 36.1236
∴ 12 = - 40 log (ω2) + 36.1236
ω2 = 4
Hence transfer function for given bode plot is

Test: Bode Plot - 3 - Question 10

What will be the Gain Margin (GM) and the Phase Margin (PM) of a closed loop
TF T(s) = 500000/(s2 + 700s + 250000) ?

Detailed Solution for Test: Bode Plot - 3 - Question 10

For a negative unity feedback system, if CLTF is given, the Open-loop transfer function is evaluated as:

The phase margin is defined as:
PM = 180 − ϕ
where ϕ is the phase of the OLTF at ωg
ωgc (Gain crossover frequency) = frequency at which system gain is unity.
If the polar plot is not crossing the negative real axis, then GM = ∞
For a negative unity feedback system, the phase at ω = 0 is 0 degrees.
And phase at ω = ∞ is:
(p-z) × 90° 
p = number of open-loop poles and z = no. of open-loop zeros.

Analysis:

Replacing s with jω:

25× 1010 = ω4 + 990000ω2 + 625× 108On solving the above, we get:
gc = 403.32 rad/sec
Now we will calculate the phase of the system at ωgc

PM = 180 + ϕ 
= 180o + (- 180o + 34.37o) = 34.37

If we draw the polar plot of the above system, then we get to see that its polar plot will not cut the negative real axis, in that case:
GM = ∞

Information about Test: Bode Plot - 3 Page
In this test you can find the Exam questions for Test: Bode Plot - 3 solved & explained in the simplest way possible. Besides giving Questions and answers for Test: Bode Plot - 3, EduRev gives you an ample number of Online tests for practice

Top Courses for Electrical Engineering (EE)

Download as PDF

Top Courses for Electrical Engineering (EE)