Electrical Engineering (EE) Exam  >  Electrical Engineering (EE) Tests  >  Test: Polar Plot - 2 - Electrical Engineering (EE) MCQ

Test: Polar Plot - 2 - Electrical Engineering (EE) MCQ


Test Description

10 Questions MCQ Test - Test: Polar Plot - 2

Test: Polar Plot - 2 for Electrical Engineering (EE) 2024 is part of Electrical Engineering (EE) preparation. The Test: Polar Plot - 2 questions and answers have been prepared according to the Electrical Engineering (EE) exam syllabus.The Test: Polar Plot - 2 MCQs are made for Electrical Engineering (EE) 2024 Exam. Find important definitions, questions, notes, meanings, examples, exercises, MCQs and online tests for Test: Polar Plot - 2 below.
Solutions of Test: Polar Plot - 2 questions in English are available as part of our course for Electrical Engineering (EE) & Test: Polar Plot - 2 solutions in Hindi for Electrical Engineering (EE) course. Download more important topics, notes, lectures and mock test series for Electrical Engineering (EE) Exam by signing up for free. Attempt Test: Polar Plot - 2 | 10 questions in 30 minutes | Mock test for Electrical Engineering (EE) preparation | Free important questions MCQ to study for Electrical Engineering (EE) Exam | Download free PDF with solutions
Test: Polar Plot - 2 - Question 1

The polar plot of the open loop transfer function of a feedback control system intersects the real axis at -2. The gain margin of the system is

Detailed Solution for Test: Polar Plot - 2 - Question 1

The gain margin is found by taking the reciprocal of the magnitude of the open-loop transfer function at the phase crossover frequency. If the polar plot intersects the real axis at −2, this means that the magnitude of the open-loop transfer function is 2 at the phase crossover frequency.

Test: Polar Plot - 2 - Question 2

The constant M circle for M = 1 is the

Detailed Solution for Test: Polar Plot - 2 - Question 2

For M = 1 the constant M circle is a straight line at x = -1/2.

1 Crore+ students have signed up on EduRev. Have you? Download the App
Test: Polar Plot - 2 - Question 3

The polar plot of a transfer function passes through the critical point (-1,0). Gain margin is

Detailed Solution for Test: Polar Plot - 2 - Question 3

Gain margin of a polar plot passing through the critical point is zero.

Test: Polar Plot - 2 - Question 4

If the gain of the open-loop system is doubled, the gain margin

Detailed Solution for Test: Polar Plot - 2 - Question 4

Gain margin is nothing but the inverse of the gain. Hence if gain of open loop system is doubled, then the gain margin will becomes half.

Test: Polar Plot - 2 - Question 5

If a system has an open loop transfer function 1-s / 1+s, then the gain of the system at frequency of 1 rad/s will be

Detailed Solution for Test: Polar Plot - 2 - Question 5

The system is all pass system and the gain of the system at frequency of 1 rad/sec.

Test: Polar Plot - 2 - Question 6

The gain margin for the system with open loop transfer function G(s) H(s) = G(s) = 2(1 + s) / s2 is

Detailed Solution for Test: Polar Plot - 2 - Question 6

Gain margin of a system is calculated at the phase cross over frequency and expressed in decibels.

Test: Polar Plot - 2 - Question 7

The open loop transfer function of a system is G(s) H(s) = K / (1 + s)(1 + 2s)(1 + 3s)
The phase cross over frequency ωc is

Detailed Solution for Test: Polar Plot - 2 - Question 7

Phase crossover frequency is calculated as by calculating the magnitude of the transfer function and equating it to 1 and the frequency calculated at this magnitude is phase cross over frequency.

Test: Polar Plot - 2 - Question 8

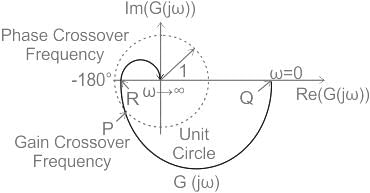
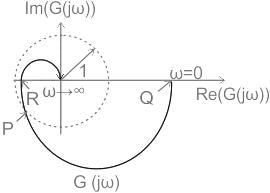
The Nyquist plot of a stable open-loop system G(jω) is plotted in the frequency range 0 ≤ ω < ∞ as shown. It is found to intersect a unit circle with center at the origin at the point �� = −0.77 − 0.64�� . The points �� and �� lie on G(jω) and assume values Q = 14.40 + 0.00j and R = −0.21 + 0.00j. The phase margin (PM) and the gain margin (GM) of the system are _____
Detailed Solution for Test: Polar Plot - 2 - Question 8

Concept

The phase margin is given by:

PM = 180° + (Phase of G(s) at gain cross-over frequency)

The frequency at which the magnitude of G(s) is unity is known as the gain cross-over frequency.

The gain margin is given by:

GM = 1/ (Gain of G(s) at phase cross-over frequency)

The frequency at which the phase angle of G(s) is -180 is known as the phase cross-over frequency.
Calculation

Point P gives gain cross-over frequency whereas point R gives phase cross-over frequency.
The phase of G(s) at gain cross-over frequency is given by:

ϕ = 39.73° 
Point P lies in the 3 quadrants, hence net angle is:
 

ϕ = 180° + 39.73° = 219.73° 

PM = 180° + 219.73° = 399.73° 

PM = 399.73° = 360° + 39.73 

PM = 39.73°

Point R = −0.21 + 0.00��

GM =  4.76

Test: Polar Plot - 2 - Question 9

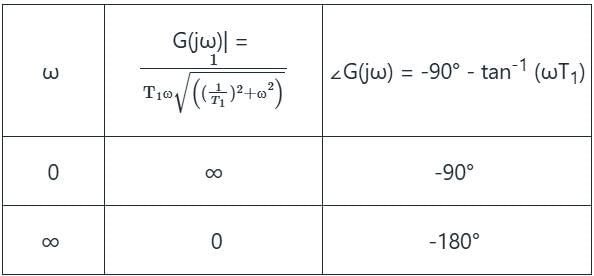
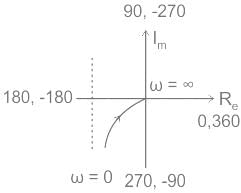
Polar plot of transfer function is

Detailed Solution for Test: Polar Plot - 2 - Question 9

Polar plot:

The polar plot is a plot, that is drawn between the magnitude and the phase angle of G(jω) by varying ω from zero 0 to ∞.


Test: Polar Plot - 2 - Question 10

Obtain the polar plot for a system whose characteristic equation is
s3 + 3s2 + 2s + 4 = 0

Detailed Solution for Test: Polar Plot - 2 - Question 10

Concept:

The characteristic equation is:

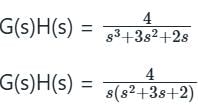
1 + G(s)H(s) = s3 + 3s2 + 2s + 4 

where G(s)H(s) is the open loop transfer function.

Calculation:

There is one pole at the origin, so the polar plot will start from -90° and end at -270° due to order = 3.


The frequency at which the phase angle of OLTF becomes -180° or the imaginary part of OLTF becomes zero is known as the phase cross-over frequency.

ωpc = √2 rad/sec
Hence, option d is correct.

Information about Test: Polar Plot - 2 Page
In this test you can find the Exam questions for Test: Polar Plot - 2 solved & explained in the simplest way possible. Besides giving Questions and answers for Test: Polar Plot - 2, EduRev gives you an ample number of Online tests for practice

Top Courses for Electrical Engineering (EE)

Download as PDF

Top Courses for Electrical Engineering (EE)