SAT Exam  >  SAT Tests  >  Test: Data Analysis - 1 - SAT MCQ

Test: Data Analysis - 1 - SAT MCQ


Test Description

10 Questions MCQ Test - Test: Data Analysis - 1

Test: Data Analysis - 1 for SAT 2025 is part of SAT preparation. The Test: Data Analysis - 1 questions and answers have been prepared according to the SAT exam syllabus.The Test: Data Analysis - 1 MCQs are made for SAT 2025 Exam. Find important definitions, questions, notes, meanings, examples, exercises, MCQs and online tests for Test: Data Analysis - 1 below.
Solutions of Test: Data Analysis - 1 questions in English are available as part of our course for SAT & Test: Data Analysis - 1 solutions in Hindi for SAT course. Download more important topics, notes, lectures and mock test series for SAT Exam by signing up for free. Attempt Test: Data Analysis - 1 | 10 questions in 15 minutes | Mock test for SAT preparation | Free important questions MCQ to study for SAT Exam | Download free PDF with solutions
Test: Data Analysis - 1 - Question 1

If data has been recorded using technical media, which among the following is a necessary step on the way to its interpretation?

Detailed Solution for Test: Data Analysis - 1 - Question 1

Transcription:

  • It is the process by which audio files are interpreted into text. If data has been recorded using technical media transcription is used for interpretation.
  • The most common type of transcription is that when computer file in transcribed into text or in any form which is suitable for printing.
  • Earlier transcription was a difficult job because secretaries have to write down the speech using various techniques like shorthand. But this work has become easier as the new possibilities have emerged and there is the advancement of technology.
  • With the birth of modern technology, the work of transcription has become much easier like speed recognition (which we can see in our mobiles as well)

Note:

  • Structural equation modelling (SEM) techniques are considered today to be a major component of applied multivariate statistical analysis and are used by education researchers, economists, marketing researchers, medical researchers, and variety of other social and behavioural scientists.
  • Sequential analysis is a statistical analysis where the sample size isn't fixed beforehand. Instead, data are evaluated as soon because it is collected, there are no predetermined rules for sampling instead everything is completed as and when samples are collected and evaluated.
  • Sampling has been an age-old practice in everyday life. Whenever we want to buy a huge quantity of a commodity, we decide about the total lot by simply examining a small fraction of it. It has been established that the sample survey if planned properly.


Hence, if data has been recorded using technical media, transcription is a necessary step on the way to its interpretation.

Test: Data Analysis - 1 - Question 2

Given below are two statements:

Statement I: In order to ensure authenticity, a researcher has to indicate original sources from which data are called.

Statement II: In data analysis and interpretation the researcher has to evince the necessary rigour and appropriateness of procedures.

In the light of the above statements, Choose the most appropriate answer from the options given below:

Detailed Solution for Test: Data Analysis - 1 - Question 2

Research is defined as the creation of new knowledge and/or the use of existing knowledge in a new and creative way so as to generate new concepts, methodologies, and understandings. This could include synthesis and analysis of previous research to the extent that it leads to new and creative outcomes.

Statement I: In order to ensure authenticity, a researcher has to indicate original sources from which data are culled.

Explanation:

  • Research ethics are the set of ethics that govern how scientific and other research is performed at research institutions such as universities, and how it is disseminated. Ethics are broadly the set of rules, written and unwritten, that govern our expectations of our own and others’ behavior.
  • Respecting intellectual property is one of the fundamental code of ethics to be followed while doing research.
  • A researcher should never plagiarise, or copy, other people’s work and try to pass it off as its own.
  • A researcher should always ask for permission before using other people’s tools or methods, unpublished data, or results. Not doing so is plagiarism.
  • A researcher needs to respect copyrights and patents, together with other forms of intellectual property, and always acknowledge other's contributions. Acknowledgment is the best way to avoid any risk of plagiarism.
  • Thus, in order to ensure authenticity, a researcher has to indicate original sources from which data are culled. The statement I is correct.

Statement II: In data analysis and interpretation the researcher has to evince the necessary rigor and appropriateness of procedures.

Explanation:

  • A researcher should aim to avoid bias in any aspect of his/her research, including design, data analysis, interpretation, and peer review.
  • This means that a researcher needs to report his/her research honestly and that this applies to the methods, data, and results.
  • A researcher should not make up any data, including extrapolating unreasonably from some results or do anything which could be construed as trying to mislead anyone. It is better to undersell than over-exaggerate findings.
  • The data must be appropriate, trustworthy, and adequate for drawing inferences.
  • The data must reflect good homogeneity.
  • Proper analysis should be done through statistical methods.
  • The researcher must remain cautious about the errors that can possibly arise in the process of interpreting results.
  • The researcher should be well equipped with and must know the correct use of statistical measures for drawing inferences concerning his study.
  • Thus, in data analysis and interpretation, the researcher has to evince the necessary rigor and appropriateness of procedures. Statement II is correct.

Thus, option A is the correct answer.

Test: Data Analysis - 1 - Question 3

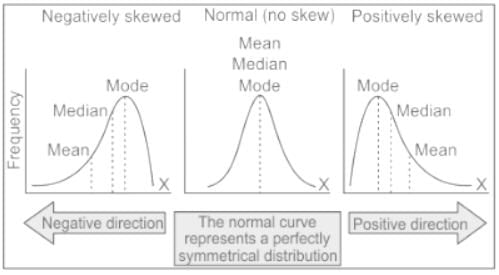
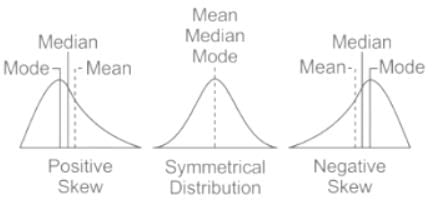
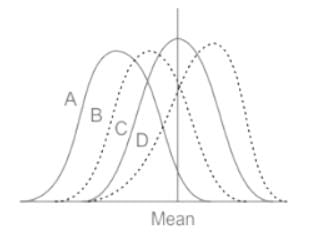
Which one of the following frequency distribution is negatively skewed?
Detailed Solution for Test: Data Analysis - 1 - Question 3

Key Points:

  • A negatively skewed distribution is the distribution composed of mostly large observations and a few relatively small observations. For example, a test score on a very easy test of some general education courses will probably follow a negatively skewed distribution. A negatively skewed (also known as left-skewed) distribution is a type of distribution in which more values are concentrated on the right side (tail) of the distribution graph while the left tail of the distribution graph is longer.
  • Most of the students will do very well, but a few students may never come to class and will score very poorly, so test scores will be composed of many high scores and a few relatively very low scores.
  • In this case, Median should be used instead of mean since it is not influenced by a few relatively very low scores.
  • in a negatively skewed distribution mean is less than the median since the mean is influenced by a few relatively very low scores.

Important Points:

  • In a Positively skewed distribution, the mean is greater than the median as the data is more towards the lower side and the mean average of all the values, whereas the median is the middle value of the data

Additional Information:

  • A positively skewed distribution is the distribution that is composed of mostly small observations and a few relatively or extremely large observations. For example, test scores on a very difficult exam probably follow a positively skewed distribution.
  • Because most students probably will Score quite low and only a few students probably will score high. To this date, I still remember my biochemistry mid-term at the University of Calcutta. we have over 120 students with 115 scores of 20- 50 out of a hundred, only less than 5 score 70 to 80. for this skewed distribution, the median is the one to use since it is not influenced by a few relative ne very high scores.

Test: Data Analysis - 1 - Question 4

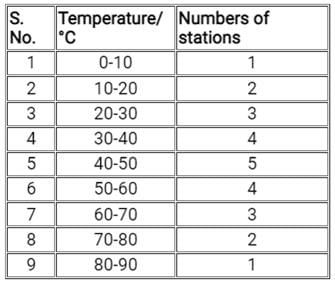
Answer the following question on the basis of above table

The average temperature in the region is

Detailed Solution for Test: Data Analysis - 1 - Question 4


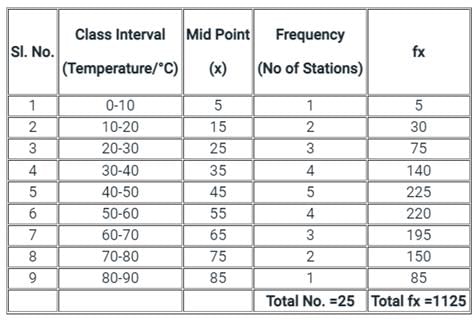
Mean or Average Temperature = =∑fx/∑N

= 1125/25

= 45

The average temperature in the region is 45°.

Test: Data Analysis - 1 - Question 5

Given below are two statements:
Statement I: Use of multivariate statistics in social research has increased due to the availability of statistical software.
Statement II: Multivariate statistics are easier to comprehend as compared to the bi‐variate statistics.
In light of the above statements, choose the correct answer from the options given below:

Detailed Solution for Test: Data Analysis - 1 - Question 5

Multivariate indicates that numerous dependent variables are combined to produce a single result.

Key Points
Statement I:
Use of multivariate statistics in social research has increased due to the availability of statistical software.

  • One of the most useful tools for determining links and analyzing patterns among big collections of data is multivariate analysis.
  • With the advent and proliferation of computers in the mid-1950s, multivariate analysis began to play an increasingly important role in social research.
  • Use of the multivariate analysis approach to perform very complex statistical analyses with the help of computers.

Thus Statement I is true.

Statement II: Multivariate statistics are easier to comprehend as compared to bivariate statistics.

  • Bivariate statistics is Inferential statistics that deals with the relationship between two variables.  
  • It looks at how one variable compares to another or how one variable influences another.
  • When there are more than two variables in a data set multivariate analysis is a more advanced form of statistical analysis technique which makes it complex as compared to the bivariate statistics.

Thus Statement II is false. 

Therefore, Statement I is true but Statement II is false.

Test: Data Analysis - 1 - Question 6

A university teacher administers a self-made test for the summative evaluation of his/her students. The distribution of scores of students is found to be positively skewed.

What inference he/she should make about the difficulty level of this test?

Detailed Solution for Test: Data Analysis - 1 - Question 6

Evolution: it is a systematic process through which one can determine the extent of the achievement of the instructional objective. It is a comprehensive process and continuous in nature.

Key Points

Summative evaluation:

  • It is done at the end of the program
  • To make a decision
  • It’s a kind of achievement test
  • The process is sometimes normative, sometimes criterion-based
  • The methods are basically oral reports, projects, term papers, teacher-made achievement tests, etc.
  • It is used for assigning a grade and final judgment
  • Feedback is also given after the evaluation

Skewness:

  • Skewness is a measure of symmetry.
  • For the normal distribution, skewness is zero.
  • If the curve shifted left or right is will be considered positively or negatively skewed respectively.
  • Galton's formula of skewness, (Q+ Q3 - 2Q2) / (Q3 - Q1)

Important Point:

Positive Skewness:

  • A positively skewed distribution is the distribution that is composed of mostly small observations and a few relatively or extreme large observations.
  • For example, test scores on a very difficult exam probably follow a positively skewed distribution.
  • This is because most students will score quite low and only a few students will score high.
  • For example: if we have over 120 students, over 115 scored 20-50 out of 100, only less than 5 scored 70-80.
  • For this skewed distribution, the median is the one to use since it is not influenced by a few relatively very high scores. 
  • In a positively skewed distribution, the mean is greater than the median, since the mean is influenced by a few relatively very large scores.

Negative Skewness:

  • A negatively skewed distribution is the distribution composed of mostly large observations and a few relatively small observations.
  • For example, test scores on a very easy test of some general education courses will probably follow a negatively skewed distribution.
  • Most students will do very well, but a few students may never come to class and will score very poorly, so test scores will be composed of many high scores and a few relatively very low scores.
  • In this case, the median should be used instead of the mean since it is not influenced by a few relatively very low scores. 
  • In a negatively skewed distribution, the mean is less than the median, since the mean is influenced by a few relatively very low scores.

Thus, a positively skewed score distribution means that the test is difficult for students.

Additional Information

Difficulty Level:

  • Cheang & Hasni (1998) defined difficulty index as the ratio of the number of students that can answer the questions correctly to the total number of the students who sit for the exams.
  • The formula is, Difficulty index = B / J, where, B = Number of students that answer the questions correctly and J = Total number of the students who sit for the exams.
  • For subjective tests, Difficulty index = Average score / Range of full marks
  • If the value comes more than 0.8, it will be considered too easy. If the index value is less than 0.5, it is hard in nature.
Test: Data Analysis - 1 - Question 7

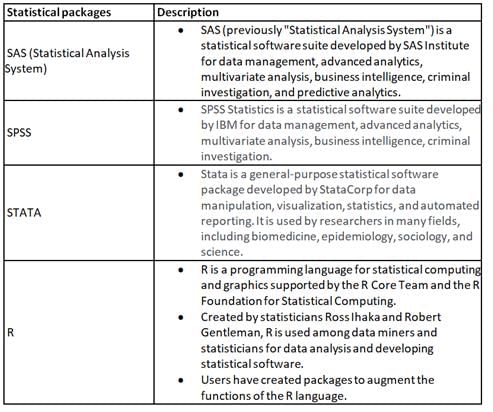
Which among the following are statistical packages?

A. SPSS

B. SAS

C. ANOVA

D. STATA

E. R

Choose the correct answer from the options given below:

Detailed Solution for Test: Data Analysis - 1 - Question 7

Statistical software is a specialized computer program for analysis in statistics and econometrics.

Important Points:

Hence, the correct answer is A, B, D, and E only.

Test: Data Analysis - 1 - Question 8

Given below are two statements, one is labelled as Assertion A and the other is labelled as Reason R
Assertion A: The value of correlation coefficient is in the range of ‐1 to +1.
Reason R: Correlation between two variables doesn't help in predicting the value of a variable even if we know the value of another variable.
In light of the above statements, choose the correct answer from the options given below

Detailed Solution for Test: Data Analysis - 1 - Question 8

The correlation coefficient is a metric for determining how strong a relationship exists between two variables.

Key Points
Assertion A: The value of the correlation coefficient is in the range of ‐1 to +1.

  • The correlation coefficient is a statistical measure of how strong a relationship exists between two variables' relative movements.
  • The range of values is -1.0 to 1.0. 
  • A value of exactly 1.0 indicates that the two variables have a perfect positive association.
  •  A score of -1.0 indicates that the two variables have a perfect negative relationship.

​So, A is true.

​Reason R: Correlation between two variables doesn't help in predicting the value of a variable even if we know the value of another variable.

  • There was an error in the correlation measurement if the calculated number was more than 1.0 or less than -1.0.
  • A perfect negative correlation is represented by a correlation of -1.0 whereas a perfect positive correlation is represented by a correlation of 1.0.
  • A correlation of 0.0 indicates that there is no linear link between the two variables' movements.
  • The degree to which the association is strong is determined by the correlation coefficient's value.

​Thus, R is true but R is NOT the correct explanation of A.

Therefore, Both A and R are true but R is NOT the correct explanation of A.

Test: Data Analysis - 1 - Question 9

When the researcher does not know the identity of the experimental and placebo groups, the study is termed as

Detailed Solution for Test: Data Analysis - 1 - Question 9

The experimental research is a scientific approach to research in which the researcher manipulates/controls one or more variables and measures its effect on the other variables. The strength of this research is its internal validity (causality). However, the influence of experimenter bias can threaten the internal validity of the research.

Controlling the Researcher’s Bias: The element of experimenter-bias effect can be controlled through the process of blinding. It is the process used in experimental research by which study participants, persons providing the treatment, data collectors and data analysts are kept unaware of group assignment (control vs treatment). There can be varying degrees of blinding such as single-blind, double-blind, triple-blind, etc.

  1. Single-blind: 
    1. In this case, the participants are unaware if they are part of the experimental group or the control group. It can be used, for example, during the test phase of a new drug, where the subjects do not know if they are actually receiving it or not.
  2. Double-blind:
    1. It describes an experimental procedure in which neither the participant nor the experimenter is aware of which group (experimental or control) each participant belongs to.
    2. It uses a rigorous way of experimenting in an attempt to minimize subjective biases on the part of the experimenter and on the part of the participant and obtain a more valid result.
    3. It is most commonly utilized in medical studies that investigate the effectiveness of drugs.

Note:

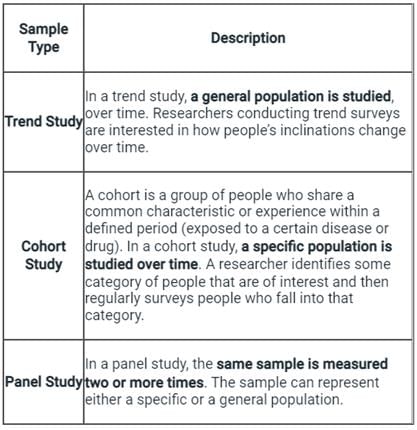
Longitudinal Research: This type of research is used to study the same sample over a longer period of time. These may be used to study behavioural changes, attitudinal changes or religious effects that may have a long time effect on the selected sample.

For example, to study the impact of the Reservation Policy of the Govt. of India to overcome inequalities since independence. Types of longitudinal surveys include:

Hence, when the researcher does not know the identity of the experimental and placebo groups, the study is termed as a double-blind study.

Test: Data Analysis - 1 - Question 10

At the stage of data analysis in which quantitative techniques have been used by a researcher, the evidence warrants the rejection of Null Hypothesis (H0). Which of the following decisions of the researcher will be deemed appropriate?

Detailed Solution for Test: Data Analysis - 1 - Question 10

The null hypothesis is the standard method for supporting the substantive research hypothesis. Like any hypothesis, a substantive hypothesis is about the relation between two or more variables. It is called “substantive” because it has not yet been operationalized. An operational hypothesis phrased to show the manipulating and measuring the variables.

  • H0 (null hypothesis): A tentative assumption is made about the parameter. This assumption is called the null hypothesis and is denoted by H0 (null hypothesis).
  • H1 (alternate hypothesis): An alternative hypothesis (denoted by H1), which is the opposite of what is stated in the null hypothesis.

The hypothesis-testing procedure involves using sample data to determine whether or not H0 can be rejected. If H0 is rejected, the statistical conclusion is that the alternative hypothesis H1 is true. If the null hypothesis is rejected, that is taken as evidence in favor of the research hypothesis which is called the alternative hypothesis (denoted by H1).

At the stage of data analysis in which quantitative techniques have been used by a researcher, the evidence warrants the rejection of the Null Hypothesis (H0). Here, the decision of the researcher which is deemed to be appropriate will be Rejecting the (H0) and accepting the substantive research hypothesis 

  1. The above statement is true in the context of the testing of a hypothesis as It is only the null hypothesis, that can be tested.
  2. To test the null hypothesis, a researcher uses ANOVA method of research
  3. At the data-analysis stage, a null hypothesis is used to find out the maintainability of the research hypothesis.
Information about Test: Data Analysis - 1 Page
In this test you can find the Exam questions for Test: Data Analysis - 1 solved & explained in the simplest way possible. Besides giving Questions and answers for Test: Data Analysis - 1, EduRev gives you an ample number of Online tests for practice
Download as PDF