SAT Exam  >  SAT Tests  >  Test (With calculator) - 2 - SAT MCQ

Test (With calculator) - 2 - SAT MCQ


Test Description

10 Questions MCQ Test - Test (With calculator) - 2

Test (With calculator) - 2 for SAT 2024 is part of SAT preparation. The Test (With calculator) - 2 questions and answers have been prepared according to the SAT exam syllabus.The Test (With calculator) - 2 MCQs are made for SAT 2024 Exam. Find important definitions, questions, notes, meanings, examples, exercises, MCQs and online tests for Test (With calculator) - 2 below.
Solutions of Test (With calculator) - 2 questions in English are available as part of our course for SAT & Test (With calculator) - 2 solutions in Hindi for SAT course. Download more important topics, notes, lectures and mock test series for SAT Exam by signing up for free. Attempt Test (With calculator) - 2 | 10 questions in 15 minutes | Mock test for SAT preparation | Free important questions MCQ to study for SAT Exam | Download free PDF with solutions
Test (With calculator) - 2 - Question 1

Which of the following numbers is NOT a solution of the inequality 3x − 5 ≥ 4x − 3?
Detailed Solution for Test (With calculator) - 2 - Question 1

Subtracting 3x and adding 3 to both sides of 3x - 5 > 4x - 3 gives -2 > x. Therefore, x is a solution to 3x - 5 > 4x -3 if and only if x is less than or equal to -2 and x is NOT a solution to 3x - 5>4x -3if and only if x is greater than -2. Of the choices given, only -1 is greater than -2 and, therefore, cannot be a value of x.
Choices B, C, and D are incorrect because each is a value of x that is less than or equal to -2 and, therefore, could be a solution to the inequality.

Test (With calculator) - 2 - Question 2


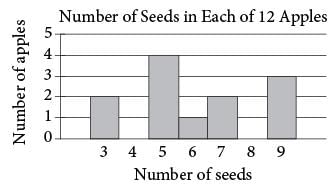
Based on the histogram above, of the following, which is closest to the average (arithmetic mean) number of seeds per apple?

Detailed Solution for Test (With calculator) - 2 - Question 2

Choice C is correct. The average number of seeds per apple is the total number of seeds in the 12 apples divided by the number of apples, which is 12. On the graph, the horizontal axis is the number of seeds per apple and the height of each bar is the number of apples with the corresponding number of seeds. The first bar on the left indicates that 2 apples have 3 seeds each, the second bar indicates that 4 apples have 5 seeds each, the third bar indicates that 1 apple has 6 seeds, the fourth bar indicates that 2 apples have 7 seeds each, and the fifth bar indicates that 3 apples have 9 seeds each. Thus, the total number of seeds for the 12 apples is
(2 x 3) + (4 x 5) + (1 x 6) + (2 x 7) + (3 x 9) = 73, and the average number of seeds per apple is 73/12 = 6.08. Of the choices given, 6 is closest to 6.08.
Choice A is incorrect; it is the number of apples represented by the tallest bar but is not the average number of seeds for the 12 apples. Choice B is incorrect; it is the number of seeds per apple corresponding to the tallest bar, but is not the average number of seeds for the 12 apples. Choice D is incorrect; a student might choose this value by correctly calculating the average number of seeds, 6.08, but incorrectly rounding up to 7.

1 Crore+ students have signed up on EduRev. Have you? Download the App
Test (With calculator) - 2 - Question 3


A group of tenth-grade students responded to a survey that asked which math course they were currently enrolled in.
The survey data were broken down as shown in the table above. Which of the following categories accounts for approximately 19 percent of all the survey respondents?

Detailed Solution for Test (With calculator) - 2 - Question 3

Choice C is correct. From the table, there was a total of 310 survey respondents, and 19% of all survey respondents is equivalent to respondents. Of the choices given, 59, the number of males taking Geometry, is closest to 58.9 respondents.
Choices A, B, and D are incorrect because the number of males taking Geometry is closer to 58.9 (which is 19% of 310) than the number of respondents in each of these categories.

Test (With calculator) - 2 - Question 4


The table above lists the lengths, to the nearest inch, of a random sample of 21 brown bullhead fish. The outlier measurement of 24 inches is an error. Of the mean, median, and range of the values listed, which will change the most if the 24-inch measurement is removed from the data?

Detailed Solution for Test (With calculator) - 2 - Question 4

Choice C is correct. The range of the lengths of the 21 fish represented in the table is 24 - 8 = 16 inches, and the range of the remaining 20 lengths after the 24-inch measurement is removed is 16 - 8 = 8 inches. Therefore, after the 24-inch measurement is removed, the change in range, 8 inches, is much greater than the change in the mean or median.
Choice A is incorrect. Let m be the mean of the lengths, in inches, of the 21 fish. Then the sum of the lengths, in inches, of the 21 fish is 21m. After the 24-inch measurement is removed, the sum of the lengths, in inches, of the remaining 20 fish is 21m -24, and the mean length, in inches, of these 20 fish is  which is a change of inches. Since m must be between the smallest and largest measurements of the 21 fish, it follows that 8 < m < 24, from which it can be seen that the change in the mean, in inches, is
betweenand so must be less than the change in the range, 8 inches. Choice B is incorrect because the median length of the 21 fish represented in the table is 12, and after the 24-inch measurement is removed, the median of the remaining 20 lengths is also 12. Therefore, the change in the median (0) is less than the change in the range (8). Choice D is incorrect because the changes in the mean, median, and range of the measurements are different.

Test (With calculator) - 2 - Question 5

What does the C-intercept represent in the graph?
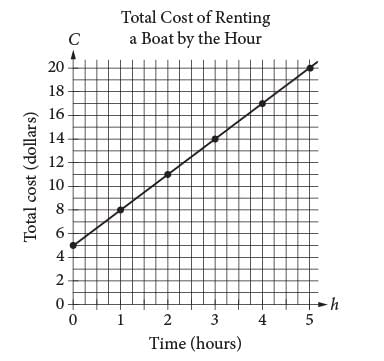
The graph above displays the total cost C, in dollars, of renting a boat for h hours.

Detailed Solution for Test (With calculator) - 2 - Question 5

The total cost C of renting a boat is the sum of the initial cost to rent the boat plus the product of the cost per hour and the number of hours, h, that the boat is rented. The C-intercept is the point on the C-axis where h, the number of hours the boat is rented, is 0. Therefore, the C-intercept is the initial cost of renting the boat.
Choice B is incorrect because the graph represents the cost of renting only one boat. Choice C is incorrect because the total number of hours of rental is represented by h-values, each of which corresponds to the first coordinate of a point on the graph not the C-intercept of the graph. Choice D is incorrect because the increase in cost for each additional hour is given by the slope of the line, not by the C-intercept.

Test (With calculator) - 2 - Question 6

Question refer to the following information.

Which of the following represents the relationship between h and C?
Detailed Solution for Test (With calculator) - 2 - Question 6

If m is the slope and b is the C-intercept of the line, the relationship between h and C can be represented by C = mh + b. The C-intercept of the line is 5. Since the points (0, 5) and (1, 8) lie on the line, the slope of the line is  Therefore,
the relationship between h and C can be represented by C=3h + 5, the slope-intercept equation of the line.
Choices A and D are incorrect because each of these equations represents a line that passes through the origin (0, 0). However, C is not equal to zero when h = 0. Choice B is incorrect and may result from errors made when reading the scale on each axis as related to calculating the slope.

Test (With calculator) - 2 - Question 7


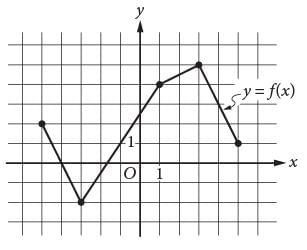
The complete graph of the function f is shown in the xy-plane above. For what value of x is the value of f (x) at its minimum?

Detailed Solution for Test (With calculator) - 2 - Question 7

The minimum value of the function corresponds to the y-coordinate of the point on the graph that has the smallest y-coordinate on the graph. Since the smallest y-coordinate belongs to the point with coordinates (-3, -2), the minimum value of the graph is f(-3) = -2. Therefore, the minimum value of f(x) is at x = -3.
Choice A is incorrect; -5 is the least value for an x-coordinate, not the y-coordinate, of a point on the graph of y = f(x). Choice C is incorrect; it is the minimum value of f, not the value of x that corresponds to the minimum of f. Choice D is incorrect; it is the value of x for which the value of f(x) has its maximum, not minimum.

Test (With calculator) - 2 - Question 8

y < -x + a
y > x + b
In the xy-plane, if (0, 0) is a solution to the system of inequalities above, which of the following relationships between a and b must be true?

Detailed Solution for Test (With calculator) - 2 - Question 8

Since (0, 0) is a solution to the system of inequalities, substituting 0 for x and 0 for y in the given system must result in two true inequalities. After this substitution, y < -x + a becomes 0< a, and y > x + b becomes 0 > b. Hence, a is positive and b is negative. Therefore, a > b.
Choice B is incorrect because b > a cannot be true if b is negative and a is positive. Choice C is incorrect because it is possible to find an example where (0, 0) is a solution to the system, but |a| > |b|; for example, if a = 6 and b = -7. Choice D is incorrect because the equation a = -b doesn’t have to be true; for example, (0, 0) is a solution to the system of inequalities if a = 1 and b = -2.

Test (With calculator) - 2 - Question 9

A food truck sells salads for $6.50 each and drinks for $2.00 each. The food truck’s revenue from selling a total of 209 salads and drinks in one day was $836.50. How many salads were sold that day?

Detailed Solution for Test (With calculator) - 2 - Question 9

To determine the number of salads sold, write and solve a system of two equations. Let x equal the number of salads sold and let y equal the number of drinks sold. Since a total of 209 salads and drinks were sold, the equation x + y = 209 must hold. Since salads cost $6.50 each, drinks cost $2.00 each, and the total revenue from selling x salads and y drinks was $836.50, the equation 6.50x + 2.00y= 836.50 must also hold. The equation x + y = 209 is equivalent to 2x + 2y = 418, and subtracting (2x + 2y) from the left-hand side and subtracting 418 from the right-hand side of 6.50x + 2.00y = 836.50 gives 4.5x = 418.50. Therefore, the number of salads sold, x, was x = 418.50/4.50 = 93.
Choices A, C, and D are incorrect and could result from errors in writing the equations and solving the system of equations. For example, choice C could have been obtained by dividing the total revenue, $836.50, by the total price of a salad and a drink, $8.50, and then rounding up.

Test (With calculator) - 2 - Question 10

Alma bought a laptop computer at a store that gave a 20 percent discount off its original price. The total amount she paid to the cashier was p dollars, including an 8 percent sales tax on the discounted price. Which of the following represents the original price of the computer in terms of p?

Detailed Solution for Test (With calculator) - 2 - Question 10

Let x be the original price of the computer, in dollars. The discounted price is 20 percent off the original price, so x - O.Zx = 0.8x is the discounted price, in dollars. The sales tax is 8 percent of the discounted price, so 0.08(0.8x) represents the sales tax Alma paid. The price p, in dollars, that Alma paid the cashiers is the sum of the discounted price and the tax: p = 0.8x + (0.08)(0.8x) which can be rewritten as p = 1.08(0.8x). Therefore, the original price, x, of the computer, in dollars, can be written as  in terms of p.
Choices A, B, and C are incorrect. The expression in choice A represents 88% of the amount Alma paid to the cashier, and can be obtained by subtracting the discount of 20% from the original price and adding the sales tax of 8%. However, this is incorrect because 8% of the tax is over the discounted price, not the original one. The expression in choice B is the result of adding the factors associated with the discount and sales tax, 0.8 and .08, rather than multiplying them. The expression in choice C results from assigning p to represent the original price of the laptop, rather than to the amount Alma paid to the cashier.

Information about Test (With calculator) - 2 Page
In this test you can find the Exam questions for Test (With calculator) - 2 solved & explained in the simplest way possible. Besides giving Questions and answers for Test (With calculator) - 2, EduRev gives you an ample number of Online tests for practice

Top Courses for SAT

Download as PDF

Top Courses for SAT