Test: ACT Physics Data Representation Questions - ACT MCQ
10 Questions MCQ Test - Test: ACT Physics Data Representation Questions
A student was interested in determining the relationship between the current, voltage, and resistance in a direct circuit, such as those exemplified by batteries connected to light bulbs. The student built the circuit presented in Figure 1 using a 2 ohm resistor.
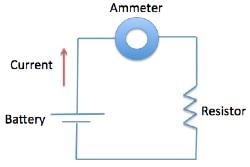
The current that flows through the circuit can be calculated using the equation V=IR, where V is the voltage of the battery, I is the current flowing through the circuit, and R is the resistance of the resistor.
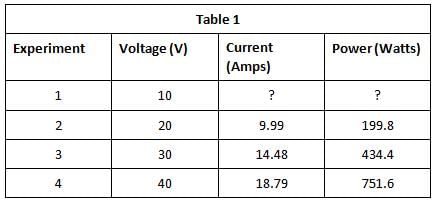
The student used a 2 ohm resistor and batteries of various voltages to obtain the results in Table 1. The currents shown in the table are NOT calculated using the formula V=IR, but instead directly measured from the circuit using an ammeter. It is important to note that the measured current will only exactly equal the calculated current if the system contains no internal resistance.
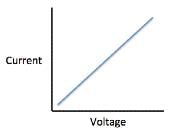
Q. Which of the following shows a possible graphical relationship between current and voltage?

The current that flows through the circuit can be calculated using the equation V=IR, where V is the voltage of the battery, I is the current flowing through the circuit, and R is the resistance of the resistor.

A student was interested in determining the relationship between the current, voltage, and resistance in a direct circuit, such as those exemplified by batteries connected to light bulbs. The student built the circuit presented in Figure 1 using a 2 ohm resistor.
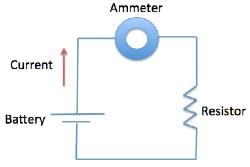
The current that flows through the circuit can be calculated using the equation V=IR, where V is the voltage of the battery, I is the current flowing through the circuit, and R is the resistance of the resistor.
The student used a 2 ohm resistor and batteries of various voltages to obtain the results in Table 1. The currents shown in the table are NOT calculated using the formula V=IR, but instead directly measured from the circuit using an ammeter. It is important to note that the measured current will only exactly equal the calculated current if the system contains no internal resistance.
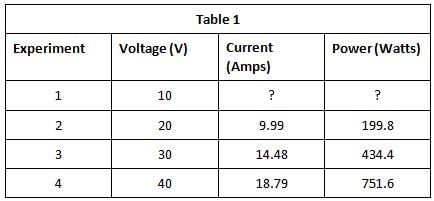
Q. In Experiment 1, how much current is most likely flowing through the circuit?

The current that flows through the circuit can be calculated using the equation V=IR, where V is the voltage of the battery, I is the current flowing through the circuit, and R is the resistance of the resistor.

Sound waves travel through a medium by mechanically disturbing the particles of that medium. As particles in the medium are displaced by the sound wave, they in turn act upon neighboring particles. In this fashion, the wave travels through the medium through a parallel series of disturbed particles. Like in other forms of motion, the rate at which the sound wave travels can be measured by dividing the distance over which the wave travels by the time required for it to do so.
Study 1
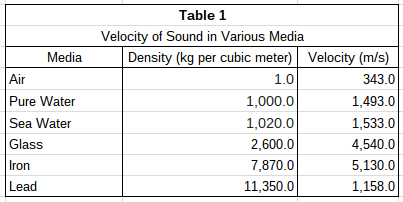
A group of students hypothesizes that the velocity of sound is dependent upon the density of the medium through which it passes. They propose that with more matter in a given space, each particle needs to travel a shorter distance to disturb the adjacent particles. Using two microphones and a high speed recording device, the students measured the delay from the first microphone to the second. They chose a variety of media, shown in Table 1, and measured the velocity of sound through each using their two-microphone setup. The results are found in Table 1.
Study 2
The students wanted to test their hypothesis by using the same medium at different densities. To do this, they heated pure water to various temperatures and repeated the procedure described in Study 1. Their results can be found in Table 2.
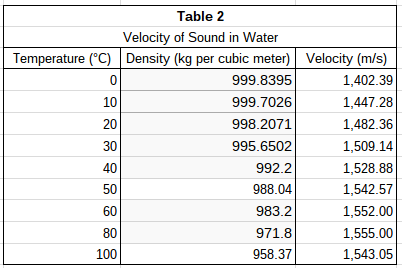
According to Study 2, water at which of the following temperatures yields the greatest velocity of sound?
A group of students hypothesizes that the velocity of sound is dependent upon the density of the medium through which it passes. They propose that with more matter in a given space, each particle needs to travel a shorter distance to disturb the adjacent particles. Using two microphones and a high speed recording device, the students measured the delay from the first microphone to the second. They chose a variety of media, shown in Table 1, and measured the velocity of sound through each using their two-microphone setup. The results are found in Table 1.

The students wanted to test their hypothesis by using the same medium at different densities. To do this, they heated pure water to various temperatures and repeated the procedure described in Study 1. Their results can be found in Table 2.

Sound waves travel through a medium by mechanically disturbing the particles of that medium. As particles in the medium are displaced by the sound wave, they in turn act upon neighboring particles. In this fashion, the wave travels through the medium through a parallel series of disturbed particles. Like in other forms of motion, the rate at which the sound wave travels can be measured by dividing the distance over which the wave travels by the time required for it to do so.
Study 1
A group of students hypothesizes that the velocity of sound is dependent upon the density of the medium through which it passes. They propose that with more matter in a given space, each particle needs to travel a shorter distance to disturb the adjacent particles. Using two microphones and a high speed recording device, the students measured the delay from the first microphone to the second. They chose a variety of media, shown in Table 1, and measured the velocity of sound through each using their two-microphone setup. The results are found in Table 1.

Study 2
The students wanted to test their hypothesis by using the same medium at different densities. To do this, they heated pure water to various temperatures and repeated the procedure described in Study 1. Their results can be found in Table 2.

According to the data in Study 1, as density increases, what happens to the velocity of sound?
Sound waves travel through a medium by mechanically disturbing the particles of that medium. As particles in the medium are displaced by the sound wave, they in turn act upon neighboring particles. In this fashion, the wave travels through the medium through a parallel series of disturbed particles. Like in other forms of motion, the rate at which the sound wave travels can be measured by dividing the distance over which the wave travels by the time required for it to do so.
Study 1
A group of students hypothesizes that the velocity of sound is dependent upon the density of the medium through which it passes. They propose that with more matter in a given space, each particle needs to travel a shorter distance to disturb the adjacent particles. Using two microphones and a high speed recording device, the students measured the delay from the first microphone to the second. They chose a variety of media, shown in Table 1, and measured the velocity of sound through each using their two-microphone setup. The results are found in Table 1.

Study 2
The students wanted to test their hypothesis by using the same medium at different densities. To do this, they heated pure water to various temperatures and repeated the procedure described in Study 1. Their results can be found in Table 2.

In Study 1, which medium tested had the greatest density?
Sound waves travel through a medium by mechanically disturbing the particles of that medium. As particles in the medium are displaced by the sound wave, they in turn act upon neighboring particles. In this fashion, the wave travels through the medium through a parallel series of disturbed particles. Like in other forms of motion, the rate at which the sound wave travels can be measured by dividing the distance over which the wave travels by the time required for it to do so.
Study 1
A group of students hypothesizes that the velocity of sound is dependent upon the density of the medium through which it passes. They propose that with more matter in a given space, each particle needs to travel a shorter distance to disturb the adjacent particles. Using two microphones and a high speed recording device, the students measured the delay from the first microphone to the second. They chose a variety of media, shown in Table 1, and measured the velocity of sound through each using their two-microphone setup. The results are found in Table 1.

Study 2
The students wanted to test their hypothesis by using the same medium at different densities. To do this, they heated pure water to various temperatures and repeated the procedure described in Study 1. Their results can be found in Table 2.

According to Study 2, over what temperature interval does velocity begin to decrease as water temperature rises?
The graph below depicts the position of three different cars over a 15-second time interval.
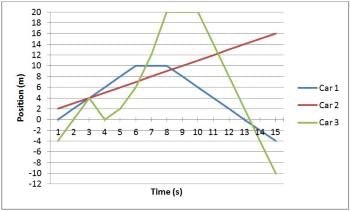
What is the speed of Car 1 at time = 7s?
The graph below depicts the position of three different cars over a 15-second time interval.
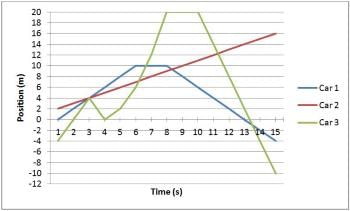
At the point where all three cars meet, which car is traveling the fastest?
A physicist wishes to study the trajectory of a ball launched horizontally. She varies parameters such as the launching velocity, starting height, and mass of the ball. For each trajectory, she records the time of flight (in seconds) and horizontal displacement (in meters). She assumes air resistance is negligible.
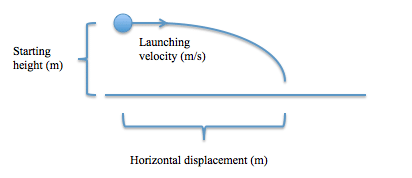
Using all of the data she collects, she constructs the following table:
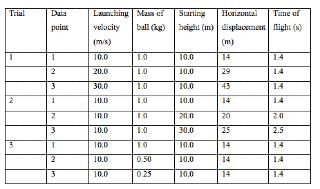
In Trial 1, if a fourth data point were collected in which the ball was thrown with a launching velocity of 40 m/s, what would be the approximate horizontal displacement in meters?
A physicist wishes to study the trajectory of a ball launched horizontally. She varies parameters such as the launching velocity, starting height, and mass of the ball. For each trajectory, she records the time of flight (in seconds) and horizontal displacement (in meters). She assumes air resistance is negligible.

Using all of the data she collects, she constructs the following table:
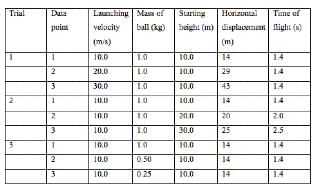
If all of trial 3 were redone with a launching velocity of 20 m/s instead of 10 m/s, then compared to the data for trial 3 presented in the table, the horizontal displacement for all data points would be which of the following?


