MCQ Test: Missing Data Interpretation - 2 - Banking Exams MCQ
20 Questions MCQ Test - MCQ Test: Missing Data Interpretation - 2

Directions: Study the following table chart carefully and answer the questions given beside.
Given below is a table that provides information about the number of pools in different states during different years.
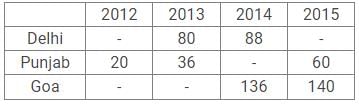
The average of number of pools in the 3 states in 2015 is 100. The ratio of number of pools in Goa in 2012 and 2013 was 9: 10 and the total number of pool in Goa in the 4 years combined was 504. The number of pools in Delhi in 2012 was half of the number of pools in Goa in 2012. The number of pools in Punjab in 2014 was 2/3 of the number of pools in Punjab in 2015.
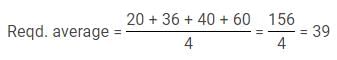
Q. What was the average of the number of pools in Punjab during the period 2012 to 2015?
Given below is a table that provides information about the number of pools in different states during different years.
The average of number of pools in the 3 states in 2015 is 100. The ratio of number of pools in Goa in 2012 and 2013 was 9: 10 and the total number of pool in Goa in the 4 years combined was 504. The number of pools in Delhi in 2012 was half of the number of pools in Goa in 2012. The number of pools in Punjab in 2014 was 2/3 of the number of pools in Punjab in 2015.

Directions: Study the following table chart carefully and answer the questions given beside.
Given below is a table that provides information about the number of pools in different states during different years.

The average of number of pools in the 3 states in 2015 is 100. The ratio of number of pools in Goa in 2012 and 2013 was 9: 10 and the total number of pool in Goa in the 4 years combined was 504. The number of pools in Delhi in 2012 was half of the number of pools in Goa in 2012. The number of pools in Punjab in 2014 was 2/3 of the number of pools in Punjab in 2015.
Q. The number of pools in Delhi in 2012 was what percentage of the number of pools in Goa in 2013 and 2014 combined?
Given below is a table that provides information about the number of pools in different states during different years.
The average of number of pools in the 3 states in 2015 is 100. The ratio of number of pools in Goa in 2012 and 2013 was 9: 10 and the total number of pool in Goa in the 4 years combined was 504. The number of pools in Delhi in 2012 was half of the number of pools in Goa in 2012. The number of pools in Punjab in 2014 was 2/3 of the number of pools in Punjab in 2015.


Directions: Study the following table chart carefully and answer the questions given beside.
Given below is a table that provides information about the number of pools in different states during different years.

The average of number of pools in the 3 states in 2015 is 100. The ratio of number of pools in Goa in 2012 and 2013 was 9: 10 and the total number of pool in Goa in the 4 years combined was 504. The number of pools in Delhi in 2012 was half of the number of pools in Goa in 2012. The number of pools in Punjab in 2014 was 2/3 of the number of pools in Punjab in 2015.
Q. If in 2016, the number of pools in Delhi and Punjab was increased by 20% and 10%, respectively as compared to the previous year, then what was the total number of pools in Delhi and Punjab combined in 2016?
Given below is a table that provides information about the number of pools in different states during different years.
The average of number of pools in the 3 states in 2015 is 100. The ratio of number of pools in Goa in 2012 and 2013 was 9: 10 and the total number of pool in Goa in the 4 years combined was 504. The number of pools in Delhi in 2012 was half of the number of pools in Goa in 2012. The number of pools in Punjab in 2014 was 2/3 of the number of pools in Punjab in 2015.
Directions: Study the following table chart carefully and answer the questions given beside.
Given below is a table that provides information about the number of pools in different states during different years.

The average of number of pools in the 3 states in 2015 is 100. The ratio of number of pools in Goa in 2012 and 2013 was 9: 10 and the total number of pool in Goa in the 4 years combined was 504. The number of pools in Delhi in 2012 was half of the number of pools in Goa in 2012. The number of pools in Punjab in 2014 was 2/3 of the number of pools in Punjab in 2015.
Q. What was the ratio of the total number of pools in the 3 states combined in 2014 to the total number of pools in the 3 states combined in 2013?
Directions: Study the following table chart carefully and answer the questions given beside.
Given below is a table that provides information about the number of pools in different states during different years.

The average of number of pools in the 3 states in 2015 is 100. The ratio of number of pools in Goa in 2012 and 2013 was 9: 10 and the total number of pool in Goa in the 4 years combined was 504. The number of pools in Delhi in 2012 was half of the number of pools in Goa in 2012. The number of pools in Punjab in 2014 was 2/3 of the number of pools in Punjab in 2015.
Q. What was the difference between the total number of pools of all the three given cities in 2012 and in 2015?
Directions: Study the following table chart carefully and answer the questions given beside.
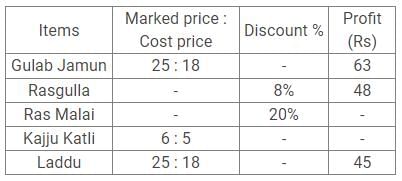
The table shows the Ratio of the Marked price and cost price of the items and the discount % and the profit earned by Mohit. Some data is missing.

Q. Cost price of Ras Malai is as same as the cost price of Rasgulla. The marked price of Rasgulla is 25% more than the cost price. Find the profit earned by Mohit after selling the Ras Malai if the marked price of Ras Malai is 56.25% more than the cost price of Ras Malai.
Directions: Study the following table chart carefully and answer the questions given beside.
The table shows the Ratio of the Marked price and cost price of the items and the discount % and the profit earned by Mohit. Some data is missing.

Q. If the difference between the cost price and the marked price of Kajju Katli is Rs 100 and profit earned by Mohit is Rs 70. Find the ratio of the discount % and profit %.


Directions: Study the following table chart carefully and answer the questions given beside.
The table shows the Ratio of the Marked price and cost price of the items and the discount % and the profit earned by Mohit. Some data is missing.
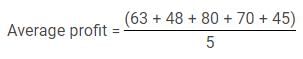
Q. With the help of information given in previous questions, find the average profit earned by mohit on selling all the sweets.
Directions: Study the following table chart carefully and answer the questions given beside.
The table shows the Ratio of the Marked price and cost price of the items and the discount % and the profit earned by Mohit. Some data is missing.

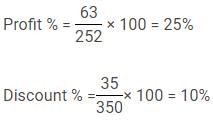
Q. If the Discount given by Mohit on Gulab Jamun is Rs 35, find the difference between the discount % and profit% given by Mohit on Gulab Jamun.
Directions: Study the following table chart carefully and answer the questions given beside.
The table shows the Ratio of the Marked price and cost price of the items and the discount % and the profit earned by Mohit. Some data is missing.

Q. The discount given by Mohit is Rs 40 less than the profit earned by Mohit on Kajju Katli. If the Marked price of Kajju Katli is Rs 600, find the discount %.

Directions: Study the following table chart carefully and answer the questions given beside.
The missing table below shows the wallet of different colours Black, Red, blue and white sold by four different shopkeepers A, B, C and D.

Q. If each black wallet, each red wallet, each blue wallet and each white wallet sold by shopkeeper A was Rs. 80, Rs. 60, Rs. 50 and Rs. 40 respectively then what was the amount generated by shopkeeper A after selling the wallets?
Directions: Study the following table chart carefully and answer the questions given beside.
The missing table below shows the wallet of different colours Black, Red, blue and white sold by four different shopkeepers A, B, C and D.

Q. What is the total wallet sold by D?
Directions: Study the following table chart carefully and answer the questions given beside.
The missing table below shows the wallet of different colours Black, Red, blue and white sold by four different shopkeepers A, B, C and D.

Q. What is the ratio of white wallet sold by A to red wallet sold by C?
Directions: Study the following table chart carefully and answer the questions given beside.
The missing table below shows the wallet of different colours Black, Red, blue and white sold by four different shopkeepers A, B, C and D.

Q. C gives discount on some wallet. 20% of black wallet, 30% of red wallet, 10% of blue wallet and 15% of white wallet sold at discount. Find total wallet sold at discount by C.
Directions: Study the following table chart carefully and answer the questions given beside.
The missing table below shows the wallet of different colours Black, Red, blue and white sold by four different shopkeepers A, B, C and D.
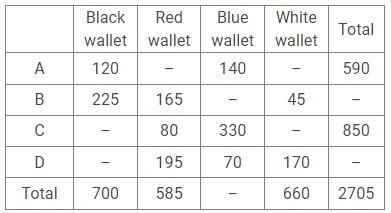
Q. Which of the following is correct?
Table shows the percentage of students of 4 departments – Mechanical, Civil, Computer Science and Applied with each student in only one department.
The table also shows the number of students in five different colleges of 4 different departments with total students being 2130.

Q. What is the total number of students in Computer Science departments of IIT Kanpur and IIT Guwahati?
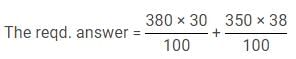
Table shows the percentage of students of 4 departments – Mechanical, Civil, Computer Science and Applied with each student in only one department.
The table also shows the number of students in five different colleges of 4 different departments with total students being 2130.

Q. If in IIT Delhi, students who are studying in Applied department are 40% more than the students in the Mechanical department, then what is the number of students who are studying in Computer Science in IIT Delhi?
Table shows the percentage of students of 4 departments – Mechanical, Civil, Computer Science and Applied with each student in only one department.
The table also shows the number of students in five different colleges of 4 different departments with total students being 2130.

Q. If number of students in IIT Bombay is 10% less than the number of students in IIT Madras, then what is the difference between the total number of students who study in Applied department in these 2 colleges and who study in Civil department in these 2 colleges?

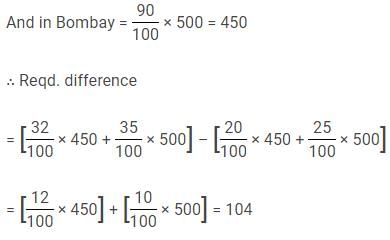
Table shows the percentage of students of 4 departments – Mechanical, Civil, Computer Science and Applied with each student in only one department.
The table also shows the number of students in five different colleges of 4 different departments with total students being 2130.

Q. If number of students in IIT Bombay is 10% less than the number of students in IIT Madras, then in which college the total students who study in Civil and Applied departments is most?
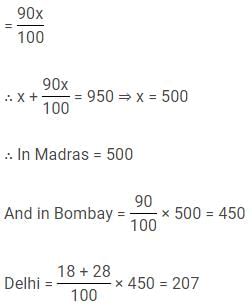
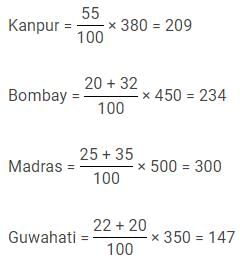
Table shows the percentage of students of 4 departments – Mechanical, Civil, Computer Science and Applied with each student in only one department.
The table also shows the number of students in five different colleges of 4 different departments with total students being 2130.
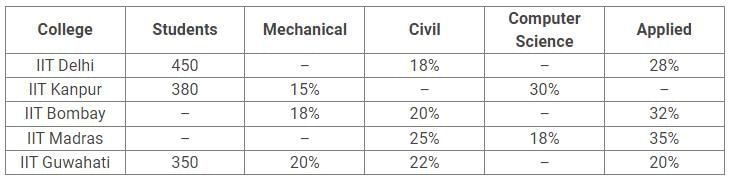
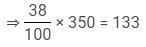
Q. If in IIT Kanpur, number of students who study in Applied department is 19 more than the number of students who study in Computer Science department in IIT Guwahati , then what is the number of students who study in Civil department in IIT Kanpur?


Important Questions for MCQ Test: Missing Data Interpretation - 2
MCQ Test: Missing Data Interpretation - 2
Online Tests for MCQ Test: Missing Data Interpretation - 2
|
© EduRev
|
Education Revolution
|


|


within 7 days!