Banking Exams Exam  >  Banking Exams Tests  >  MCQ Test: Bar Graphs - 2 - Banking Exams MCQ

MCQ Test: Bar Graphs - 2 - Banking Exams MCQ


Test Description

20 Questions MCQ Test - MCQ Test: Bar Graphs - 2

MCQ Test: Bar Graphs - 2 for Banking Exams 2024 is part of Banking Exams preparation. The MCQ Test: Bar Graphs - 2 questions and answers have been prepared according to the Banking Exams exam syllabus.The MCQ Test: Bar Graphs - 2 MCQs are made for Banking Exams 2024 Exam. Find important definitions, questions, notes, meanings, examples, exercises, MCQs and online tests for MCQ Test: Bar Graphs - 2 below.
Solutions of MCQ Test: Bar Graphs - 2 questions in English are available as part of our course for Banking Exams & MCQ Test: Bar Graphs - 2 solutions in Hindi for Banking Exams course. Download more important topics, notes, lectures and mock test series for Banking Exams Exam by signing up for free. Attempt MCQ Test: Bar Graphs - 2 | 20 questions in 20 minutes | Mock test for Banking Exams preparation | Free important questions MCQ to study for Banking Exams Exam | Download free PDF with solutions
MCQ Test: Bar Graphs - 2 - Question 1

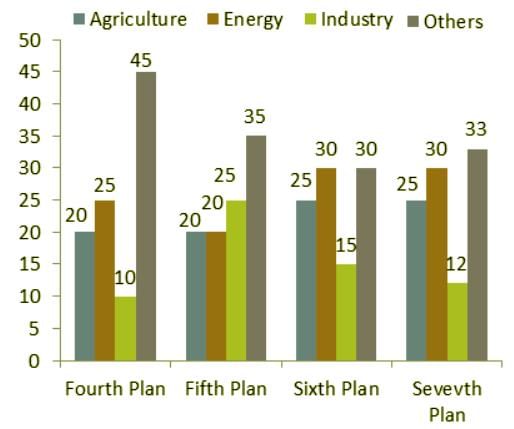
Directions: Study the following bar chart carefully and answer the questions given beside.
Public Sector Outlay (in percentage) of different sectors is given below.
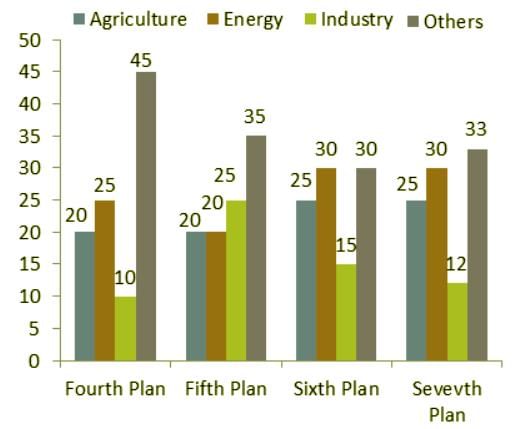
Q. In the seventh plan, the amount spent towards Industry was Rs. 26,400 crores. What was the amount spent towards Transport and Communication, if it was 40% of ‘others’?(in Rs. crores)

Detailed Solution for MCQ Test: Bar Graphs - 2 - Question 1

12% of total outlay = 26,400

Outlay = 220,000 = Rs. 2.2 lac crores

Amount spent towards transport and communication = 40% of 33% of 2.2 lac crores

= 0.4 × 33/100 × 2,20,000 = Rs. 29040 crores

Hence, Option A is correct.

MCQ Test: Bar Graphs - 2 - Question 2

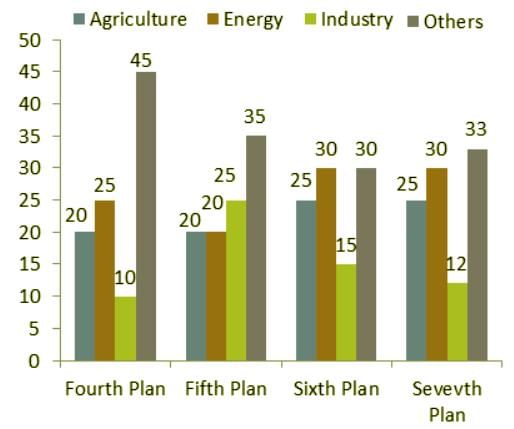
Directions: Study the following bar chart carefully and answer the questions given beside.
The Public Sector Outlay (in percentage) of different sectors is given below.

Q. During the fourth plan and the seventh plan, the total public sector outlay was Rs. 16,000 crores and Rs. 2.2 lac crores respectively. The percentage increase in deployment of funds was the maximum for which of the following sectors from the fourth plan to the seventh plan?

Detailed Solution for MCQ Test: Bar Graphs - 2 - Question 2

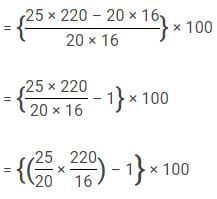
Percentage increase in agriculture sector

From the above it can be seen that the second fraction 220/16 will be the same for all four sectors. Hence, the highest percentage increase will be for the sector that has the highest value of the first fraction.

For agriculture it is 25/20 = 1.25
For Energy it is 30/25 = 1.2
For industry it is 12/10 = 1.2
For others it is a decrease.
Agriculture has the maximum percentage increase.
Hence, Option A is correct.

1 Crore+ students have signed up on EduRev. Have you? Download the App
MCQ Test: Bar Graphs - 2 - Question 3

Directions: Study the following bar chart carefully and answer the questions given beside.
Public Sector Outlay (in percentage) of different sectors is given below.
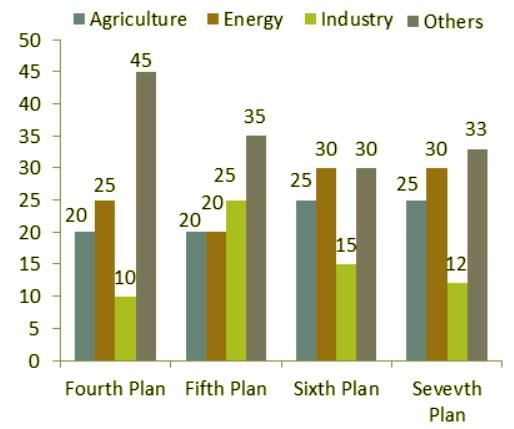
Q. Public sector outlay was Rs. 40,000 crores in the fifth plan and around Rs.1 lakh crores in the sixth plan. What is the percentage increase in the amount spent towards Energy sector from the fifth plan to the sixth plan?

Detailed Solution for MCQ Test: Bar Graphs - 2 - Question 3

Alternate solution:

The increase of allotments of funds from fifth plan to sixth plan is {30% of 1 lakh – 20%of 40,000} crores
= Rs. (30,000 – 8,000) crores = Rs. 22,000 crores
% increase = 22000 × 100/8000 = 22 × 12.5 = 275%
Hence, Option C is correct.

MCQ Test: Bar Graphs - 2 - Question 4

Directions: Study the following bar chart carefully and answer the questions given beside.
Public Sector Outlay (in percentage) of different sectors is given below.

Q. During the fifth plan, 65% of the amount spent in the Agriculture sector was through private investment. If the private investment was 5,200 crores. then, what was the total outlay of the fifth plan?

Detailed Solution for MCQ Test: Bar Graphs - 2 - Question 4

Amount spent towards Agriculture in fifth plan = 20% of total outlay
 Private investment = 5,200
 65% of 20% of total outlay = 5,200
 Total outlay = Rs.  40,000 crores
 Hence, Option C is correct.

MCQ Test: Bar Graphs - 2 - Question 5

Out of the four sectors given, how many sectors showed a consistent trend(increase or decrease) in percentage in the allocation between the fourth plan and the seventh plan

Detailed Solution for MCQ Test: Bar Graphs - 2 - Question 5

By simple observation, we can see that none of the given sectors has shown a consistent trend in allocation. 
 
Hence, Option A is correct.

MCQ Test: Bar Graphs - 2 - Question 6

Directions: Study the following bar chart carefully and answer the questions given beside.
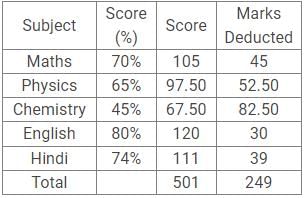
The chart given below shows the percentage marks of a student in five different subjects. The maximum marks in each subject are 150.
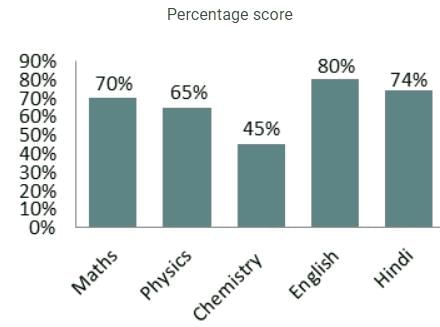
What is the average score of Physics, Chemistry and English?

Detailed Solution for MCQ Test: Bar Graphs - 2 - Question 6

Following the common explanation, we get

Average score of Physics, Chemistry and English


Hence, option E is correct.

Common explanation :

Score in Maths = 70% (150) = 105
 
Similarly calculating for each subject we get

MCQ Test: Bar Graphs - 2 - Question 7

Directions: Study the following bar chart carefully and answer the questions given beside.
The chart given below shows the percentage marks of a student in five different subjects. The maximum marks in each subject are 150.
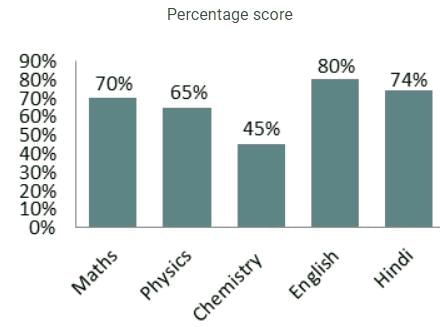
Q. The total marks deducted in Maths and Hindi is what percent of the score obtained in Maths?

Detailed Solution for MCQ Test: Bar Graphs - 2 - Question 7

Following the common explanation, we get

Total marks deducted in Maths and Hindi = 45 + 39 = 84

Hence, option C is correct.

Common explanation :

Score in Maths = 70% (150) = 105
 
Similarly calculating for each subject we get

MCQ Test: Bar Graphs - 2 - Question 8

Directions: Study the following bar chart carefully and answer the questions given beside.
The chart given below shows the percentage marks of a student in five different subjects. The maximum marks in each subject are 150.
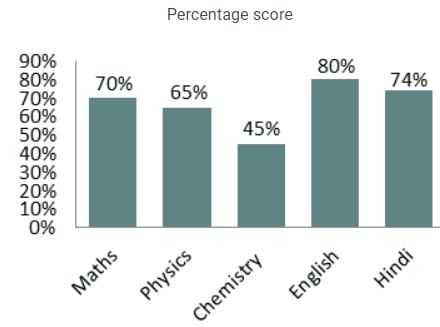
Q. What is the aggregate percentage score of all the subjects combined?

Detailed Solution for MCQ Test: Bar Graphs - 2 - Question 8

Following the common explanation, we get

Total score in all the subjects combined = 501

Total maximum marks = 5 × 150 = 750

Aggregate % score = 501/750 × 100 = 66.8%

Hence, option C is correct.

Common explanation :

Score in Maths = 70% (150) = 105
 
Similarly calculated for each subject we get

MCQ Test: Bar Graphs - 2 - Question 9

Directions: Study the following bar chart carefully and answer the questions given beside.
The chart given below shows the percentage marks of a student in five different subjects. The maximum marks in each subject are 150.
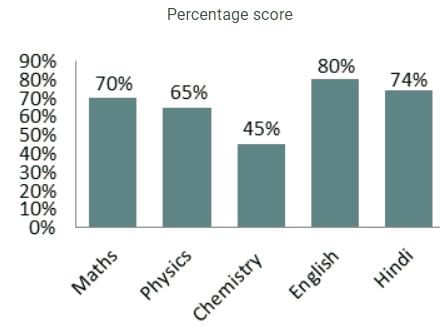
Q. The total score of Physics and Chemistry is what percent of the score of English?

Detailed Solution for MCQ Test: Bar Graphs - 2 - Question 9

Following the common explanation, we get

Total score of Physics and Chemistry = 97.5 + 67.5 = 165

Reqd. % = 165/120 × 100 = 137.5%

Hence, option B is correct.

Common explanation :

Score in Maths = 70% (150) = 105
 
Similarly calculating for each subject we get

MCQ Test: Bar Graphs - 2 - Question 10

Directions: Study the following bar chart carefully and answer the questions given beside.
The chart given below shows the percentage marks of a student in five different subjects. The maximum marks in each subject are 150.
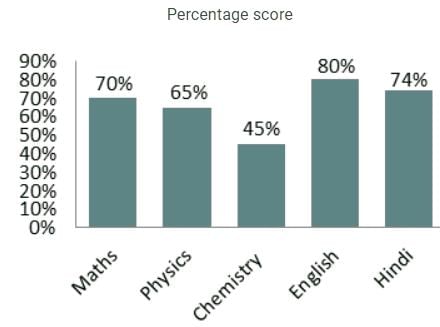
Q. The difference between the total obtained score in English and Maths is what percent of the difference between the deducted score in Physics and Chemistry?

Detailed Solution for MCQ Test: Bar Graphs - 2 - Question 10

Following the common explanation, we get

Difference between the obtained score in English and Maths = 120 – 105 = 15

Difference between the deducted score in Physics and Chemistry = 82.5 – 52.5 = 30

Reqd. % = 15/30 × 100 = 50%

Hence, option E is correct.

Common explanation :

Score in Maths = 70% (150) = 105
 
Similarly calculated for each subject we get

MCQ Test: Bar Graphs - 2 - Question 11

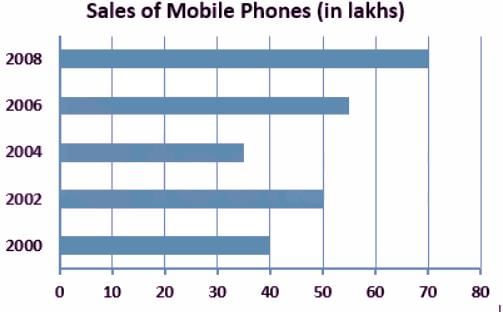
Based on the bar graph given, calculate the approximate percentage increase in sales of mobile phones from 2004 to 2008.
Detailed Solution for MCQ Test: Bar Graphs - 2 - Question 11

Calculation:

Percentage increase in sales of mobile phones in 2004 = 35

Percentage increase in sales of mobile phones in 2008 = 70

Percentage increase in sales of mobile phones from 2004 to 2008 = (70 –  35)/35 × 100

⇒ 35/35 × 100

⇒ 100%

∴ The required percentage is 100%

MCQ Test: Bar Graphs - 2 - Question 12

Study the given bar graph and answer the question that follows.

The bar graph shows the exports of cars of type A and B (in Rs. millions) from 2014 to 2018.
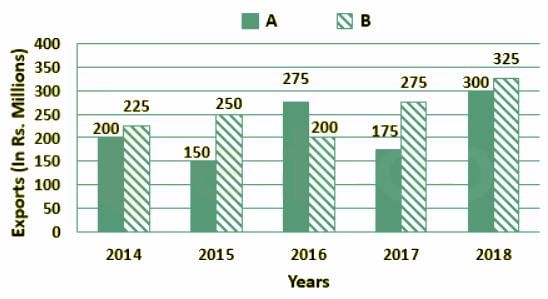
In which year were the exports of cars of type A Rs. 55 million less than the average exports (per year) of cars of type B over the five years?

Detailed Solution for MCQ Test: Bar Graphs - 2 - Question 12

Given:

There are the exports of cars of type A and B (in Rs. millions) from 2014 to 2018 in the given bar graph.

Total number of years = 5

Concept used:

Average = The sum of the terms/Number of terms

Calculation:

The average exports (per year) of cars of type B (in Rs. millions) = (225 + 250 + 200 + 275 + 325)/5 = 1275/5 = 255 (in Rs. millions)

The exports of cars of type A in 2014 (in Rs. millions) = 200

Here, 255 - 55 = 200 (in Rs. millions)

Therefore, The exports of cars of type A in 2014 is Rs. 55 million less than the average exports (per year) of cars of type B over the five years

MCQ Test: Bar Graphs - 2 - Question 13

The bar chart given below shows the total exports (in = 1000 crores of a country for 7 consecutive years Y1, Y2, Y3, Y4, Y5, Y6 and Y7.
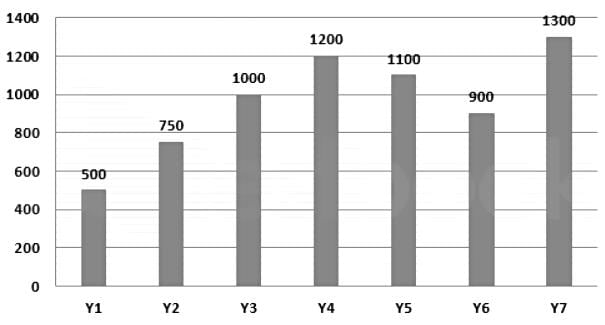
Q. What is the average exports from years Y1 to Y7?

Detailed Solution for MCQ Test: Bar Graphs - 2 - Question 13

Average exports = (500 + 750 + 1000 + 1200 + 1100 + 900 + 1300)/7

∴ Average Exports from years Y1 to Y7 = 6750/7 = 964.28

MCQ Test: Bar Graphs - 2 - Question 14

The Bar graph shown below presents the number of employees in an office during eight consecutive years.
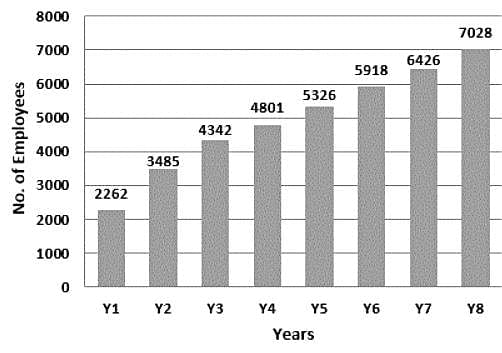
Q. What is the average number of employees per year?

Detailed Solution for MCQ Test: Bar Graphs - 2 - Question 14

Total number of employee = 2262 + 3485 + 4342 + 4801 + 5326 + 5918 + 6426 + 7028 = 39588

So, the average number of employee = 39588/8

∴ The average number of employees per year is 4948.5

MCQ Test: Bar Graphs - 2 - Question 15

Direction: The following bar graph shows the number of articles (in thousands) sold in different years. Study this graph and answer the questions.
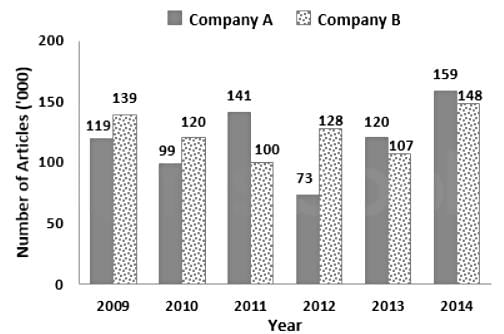
Q. If the number of articles sold by Company B in 2015 is 78% more than the difference between articles sold by Company A and Company B in 2014, then the approximate increase or decreases in the articles sold by Company B in 2015 from previous year is (approx.)

Detailed Solution for MCQ Test: Bar Graphs - 2 - Question 15

Calculations:

The articles sold by company A in 2014 = 1,59,000

The articles sold by company B in 2014 = 1,48,000

Difference between articles sold by company A and company B in 2014 = 1,59,000 – 1,48,000 = 11,000

According to the question,

The number of articles sold by company B in 2015 = 11,000 × 178/100 = 19,580

Decrease in numbers = 1,48,000 – 19,580 = 1,28,420 

Decrease % = (1,28,420/1,48,000) × 100 = 86.77% ≈ 87% 

∴ The articles sold by company B in 2015 has decreased by approx 87% from previous year.

MCQ Test: Bar Graphs - 2 - Question 16

Direction: Study the graph and answer the following questions :
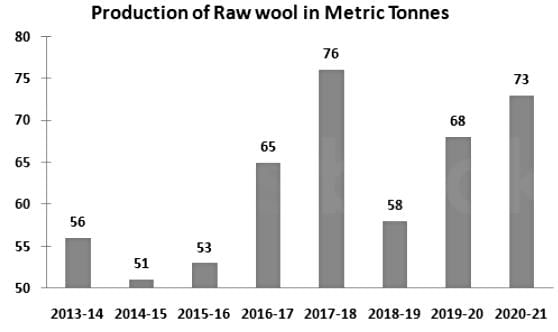
The maximum rise in the production of raw wool with respect to previous year :

Detailed Solution for MCQ Test: Bar Graphs - 2 - Question 16

Calculation:

Rise in 2015-16 = 53 – 51 = 2

Rise in 2016-17 = 65 – 53 = 12

Rise in 2017-18 = 76 – 65 = 11

Rise in 2019-20 = 68 – 58 = 10

Rise in 2020-21 = 73 – 68 = 5

∴ Maximum rise in production of wool with respect to previous year is in 2016-17

MCQ Test: Bar Graphs - 2 - Question 17

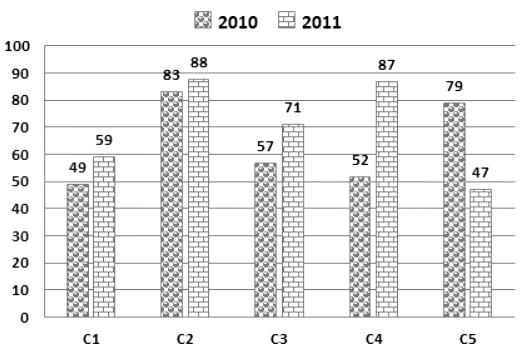
Instructions: Study the graph of the following times and answer the following question: Books (from thousands of C1, C2, C3, C4, and C5) of a publishing company in two consecutive years of 2010 and 2011) Sales. What is the average sale of all branches (in thousands) in 2010?
Detailed Solution for MCQ Test: Bar Graphs - 2 - Question 17

⇒ Total sales of all branches in 2010 = 49 + 83 + 57 + 52 + 79 = 320

∴ Required average = 320/5 = 64 

MCQ Test: Bar Graphs - 2 - Question 18

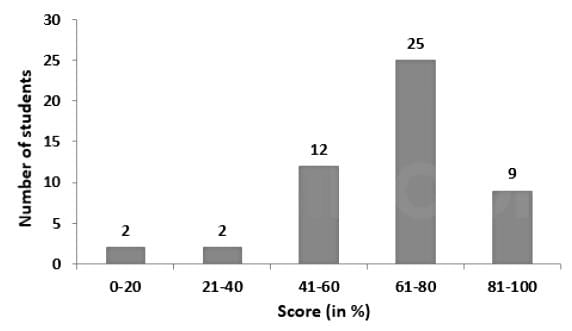
The following histogram shows the score by the students of grade 10.
What percent of total student scored more than 60%?
Detailed Solution for MCQ Test: Bar Graphs - 2 - Question 18

Calculation:

Number of students who scored more than 60% = 25 + 9 = 34

Total students = 2 + 2 + 12 + 25 + 9 = 50

Now, the required % = 34/50 × 100% = 68%
∴ 68% of total students scored more than 60%.

MCQ Test: Bar Graphs - 2 - Question 19

Directions : Study the following bar chart carefully and answer the questions given beside.
The bar diagram shows the number of students who opted for the different subjects in the year 2019 and 2020. 
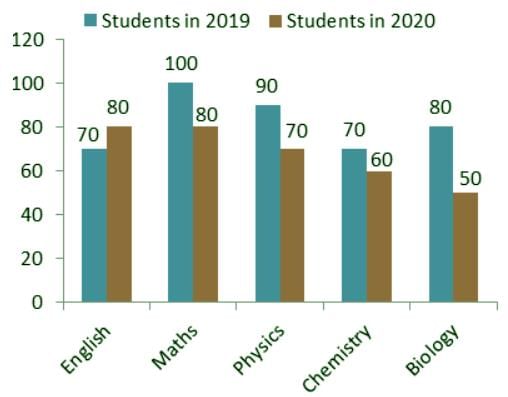
Q. Difference in the number of students in both the years is maximum in which of the following subject -

Detailed Solution for MCQ Test: Bar Graphs - 2 - Question 19

Difference in the number of students who opted English = 80 – 70 = 10
Difference in the number of students who opted Maths = 100 – 80 = 20
Difference in the number of students who opted Physics = 90 – 70 = 20
Difference in the number of students who opted Chemistry = 70 – 60 = 10
Difference in the number of students who opted Biology = 80 – 50 = 30
Maximum difference is for Biology.
Hence, option D is correct.

MCQ Test: Bar Graphs - 2 - Question 20

Directions : Study the following bar chart carefully and answer the questions given beside.
The bar diagram shows the number of students who opted for the different subjects in the year 2019 and 2020. 
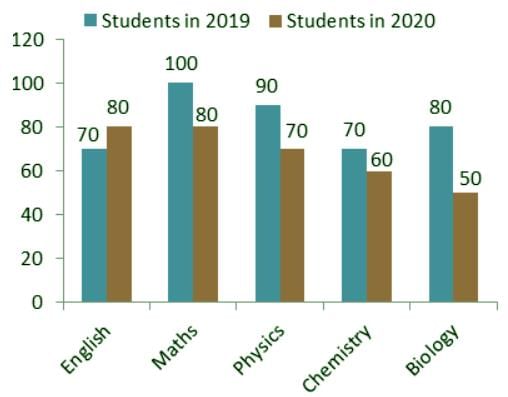
Q. The ratio of the average of the students who opted for Biology for both the years to the average of the students who opted for English and Maths in 2020 is 

Detailed Solution for MCQ Test: Bar Graphs - 2 - Question 20

Average of the students who opted for Biology for both the years

Average of the students who opted for English and Maths in 2020

Reqd. ratio =

Hence, option D is correct.

Information about MCQ Test: Bar Graphs - 2 Page
In this test you can find the Exam questions for MCQ Test: Bar Graphs - 2 solved & explained in the simplest way possible. Besides giving Questions and answers for MCQ Test: Bar Graphs - 2, EduRev gives you an ample number of Online tests for practice

Top Courses for Banking Exams

Download as PDF

Top Courses for Banking Exams