Statistical Description Of Data - 2 - Free MCQ Practice Test with solutions,
MCQ Practice Test & Solutions: Test: Statistical Description Of Data - 2 (40 Questions)
You can prepare effectively for CA Foundation Quantitative Aptitude for CA Foundation with this dedicated MCQ Practice Test (available with solutions) on the important topic of "Test: Statistical Description Of Data - 2". These 40 questions have been designed by the experts with the latest curriculum of CA Foundation 2026, to help you master the concept.
Test Highlights:
- - Format: Multiple Choice Questions (MCQ)
- - Duration: 40 minutes
- - Number of Questions: 40
Sign up on EduRev for free to attempt this test and track your preparation progress.

(Direction 1 - 20) Answer the following questions. Each question carries 1 mark.
Q. Pie-diagram is used for
Detailed Solution: Question 1
Detailed Solution: Question 2

The frequency distribution of a continuous variable is known as
Detailed Solution: Question 3
The distribution of shares is an example of the frequency distribution of
Detailed Solution: Question 4
The distribution of profits of a blue-chip company relates to
Detailed Solution: Question 5
Analysis based on study of price fluctuations, production of commodities and deposits in banks is classified as
Detailed Solution: Question 6
Mutually inclusive classification is usually meant for
Detailed Solution: Question 7
Mutually exclusive classification is usually meant for
Detailed Solution: Question 8
Detailed Solution: Question 9
Branch of statistics which deals with development of particular statistical methods is classified as
Detailed Solution: Question 10
Detailed Solution: Question 11
For a particular class boundary, the less than cumulative frequency and more than cumulative frequency add up to
Detailed Solution: Question 12
Frequency density corresponding to a class interval is the ratio of
Detailed Solution: Question 13
Relative frequency for a particular class
Detailed Solution: Question 14
Mode of a distribution can be obtained from
Detailed Solution: Question 15
Median of a distribution can be obtained from
Detailed Solution: Question 16
A comparison among the class frequencies is possible only in
Detailed Solution: Question 17
Detailed Solution: Question 18
Most of the commonly used frequency curves are
Detailed Solution: Question 19
The distribution of profits of a company follows
Detailed Solution: Question 20
(Direction 21 - 27) Answer the following questions. Each question carries 2 marks.
Q. Out of 1000 persons, 25 per cent were industrial workers and the rest were agricultural workers. 300 persons enjoyed world cup matches on TV. 30 per cent of the people who had not watched world cup matches were industrial workers. What is the number of agricultural workers who had enjoyed world cup matches on TV?
Detailed Solution: Question 21
A sample study of the people of an area revealed that total number of women were 40% and the percentage of coffee drinkers were 45 as a whole and the percentage of male coffee drinkers was 20. What was the percentage of female non-coffee drinkers?
Detailed Solution: Question 22
Cost of sugar in a month under the heads Raw Materials, labour, direct production and others were 12, 20, 35 and 23 units respectively. What is the difference between the central angles for the largest and smallest components of the cost of sugar?
Detailed Solution: Question 23
The number of accidents for seven days in a locality are given below :
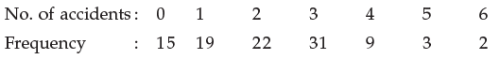
Q. What is the number of cases when 3 or less accidents occurred?
Detailed Solution: Question 24
The following data relate to the incomes of 86 persons :

Q. What is the percentage of persons earning more than Rs. 1500?
Detailed Solution: Question 25
The following data relate to the marks of a group of students:

Q. How many students got marks more than 30?
Detailed Solution: Question 26
(Direction 28 - 32) Answer the following questions. Each question carries 5 marks.
In a study about the male and female students of commerce and science departments of a college in 5 years, the following datas were obtained :
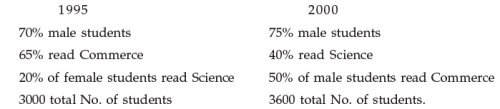
Q. After combining 1995 and 2000 if x denotes the ratio of female commerce student to female Science student and y denotes the ratio of male commerce student to male Science student, then
Detailed Solution: Question 27
In a study relating to the labourers of a jute mill in West Bengal, the following information was collected.
‘Twenty per cent of the total employees were females and forty per cent of them were married. Thirty female workers were not members of Trade Union. Compared to this, out of 600 male workers 500 were members of Trade Union and fifty per cent of the male workers were married. The unmarried non-member male employees were 60 which formed ten per cent of the total male employees. The unmarried non-members of the employees were 80’. On the basis of this information, the ratio of married male non-members to the married female non-members is
Detailed Solution: Question 28
The weight of 50 students in pounds are given below :
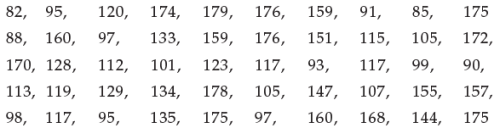
Q. If the data are arranged in the form of a frequency distribution with class intervals as 81-100, 101-120, 121-140, 141-160 and 161-180, then the frequencies for these 5 class intervals are
The following data relate to the marks of 48 students in statistics :
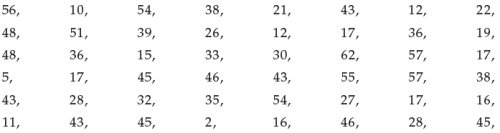
Q. What are the frequency densities for the class intervals 30-39, 40-49 and 50-59
92 videos|224 docs|83 tests |