Organisms & Populations - 1 - Free MCQ Practice Test with solutions, NEET
MCQ Practice Test & Solutions: Test: Organisms & Populations - 1 (20 Questions)
You can prepare effectively for NEET Biology Class 12 with this dedicated MCQ Practice Test (available with solutions) on the important topic of "Test: Organisms & Populations - 1". These 20 questions have been designed by the experts with the latest curriculum of NEET 2026, to help you master the concept.
Test Highlights:
- - Format: Multiple Choice Questions (MCQ)
- - Duration: 20 minutes
- - Number of Questions: 20
Sign up on EduRev for free to attempt this test and track your preparation progress.

The density of a population in a given habitat during a given period, fluctuates due to changes in certain basic processes. On this basis, fill up boxes A and B in the given flow chart with correct option.

Detailed Solution: Question 1
Topic in NCERT: Population Dynamics
Line in NCERT: "the density of a population in a given habitat during a given period, fluctuates due to changes in four basic processes, two of which (natality and immigration) contribute to an increase in population density and two (mortality and emigration) to a decrease."
What does the shape of the given age pyramids reflects about the growth status of the related population?
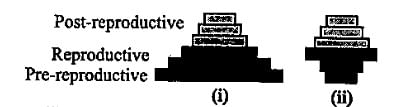
Detailed Solution: Question 2
Topic in NCERT: Age Pyramids and Population Growth Status
Line in NCERT: "The shape of the pyramids reflects the growth status of the population - (a) whether it is growing, (b) stable or (c) declining."

In a pond, last year there were 30 lotus plants. Through reproduction, 25 new lotus plants were added in one year while 8 plants died. The birth and death rates for the lotus population respectively are ___ and ____ individuals per lotus per year.
Detailed Solution: Question 3
In a given population of 2000 individuals, 80 births and 125 deaths were reported over a given period of time. Which of the following graphs will correspond to it?
Detailed Solution: Question 4
If N population density at time t, then population density at time t+1 can be written as
Nt +1=Nt +[(A+B)−(C+D)]
Select the correct option for A, B, C and D in the above equation.
Select the correct option for A, B, C and D in the above equation.
Detailed Solution: Question 5
Topic in NCERT: Population Growth Models
Line in NCERT: "Nt+1 = Nt + [(B + I) - (D + E)]"
The given figure represents different factors affecting population density (N) If B = nasality, D = mortality, E = emigration and I = immigration; then select the incorrect option regarding these.
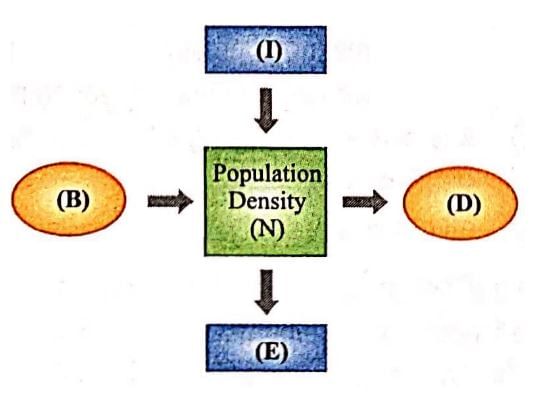
Detailed Solution: Question 6
In a population per capita birth rate is 0.15 and per capita death rate is 0.08 during a unit time period. What is the value of r (intrinsic rate of natural increase) for the given population?
Detailed Solution: Question 7
Topic in NCERT: Intrinsic Rate of Natural Increase
Line in NCERT: "The r in this equation is called the ‘intrinsic rate of natural increase' and is a very important parameter chosen for assessing impacts of any biotic or abiotic factor on population growth."
The maximum possible number of individuals that a habitat can support is called its
Detailed Solution: Question 8
Topic in NCERT: Carrying Capacity
Line in NCERT: "In nature, a given habitat has enough resources to support a maximum possible number, beyond which no further growth is possible. Let us call this limit as nature's carrying capacity (K) for that species in that habitat."
Which of the following equations correctly represents verhulst-Pearl logistic growth?
Detailed Solution: Question 9

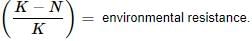
Topic in NCERT: Logistic Growth
Line in NCERT: "This type of population growth is called Verhulst-Pearl Logistic Growth and is described by the following equation: dN/dt = rN(K-N)"
Study the population growth curves (A and B) in the given graph and select the incorrect option
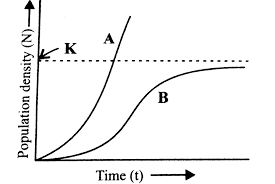
Detailed Solution: Question 10
Topic in NCERT: Logistic Growth Model
Line in NCERT: "Since resources for growth for most animal populations are finite and become limiting sooner or later, the logistic growth model is considered a more realistic one."
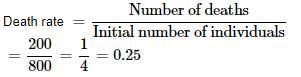
In a life table, the number of individuals alive at the beginning of the 1 st year to 2 nd year interval is 800. During this interval, 200 individuals die. The death rate for this interval is
Detailed Solution: Question 11
In a laboratory population of fruit flies, if 4 individuals died during a specified time interval and the population had 40 fruit flies, what is the death rate?
Detailed Solution: Question 12
Topic in NCERT: Population Dynamics
Line in NCERT: "If 4 individuals in a laboratory population of 40 fruitflies died during a specified time interval, say a week, the death rate in the population during that period is 4/40 = 0.1 individuals per fruitfly per week."