Civil Engineering (CE) Exam  >  Civil Engineering (CE) Tests  >  Test: Regression Analysis - Civil Engineering (CE) MCQ

Test: Regression Analysis - Civil Engineering (CE) MCQ


Test Description

10 Questions MCQ Test - Test: Regression Analysis

Test: Regression Analysis for Civil Engineering (CE) 2024 is part of Civil Engineering (CE) preparation. The Test: Regression Analysis questions and answers have been prepared according to the Civil Engineering (CE) exam syllabus.The Test: Regression Analysis MCQs are made for Civil Engineering (CE) 2024 Exam. Find important definitions, questions, notes, meanings, examples, exercises, MCQs and online tests for Test: Regression Analysis below.
Solutions of Test: Regression Analysis questions in English are available as part of our course for Civil Engineering (CE) & Test: Regression Analysis solutions in Hindi for Civil Engineering (CE) course. Download more important topics, notes, lectures and mock test series for Civil Engineering (CE) Exam by signing up for free. Attempt Test: Regression Analysis | 10 questions in 30 minutes | Mock test for Civil Engineering (CE) preparation | Free important questions MCQ to study for Civil Engineering (CE) Exam | Download free PDF with solutions
Test: Regression Analysis - Question 1

Consider the following learning algorithms:

(a) Logistic regression

(b) Back propagation

(c) Linear repression

Which of the following option represents classification algorithms?

Detailed Solution for Test: Regression Analysis - Question 1

Concept:

Learning algorithms: These algorithms are used in machine learning to help technology in human learning process. It is used to process data to extract patterns appropriate for application in a new system.

Explanation:

From above given options, only a) and b) are learning algorithms.

a) Logistic regression: It is used for binary classification problems. It is used to examine and describe the relationship between a binary variable and set of predicator variables.  The primary objective of logistic regression is to model the mean of the response variables, given a set or predicator variables.

b) Back propagation: It is the essence of neural net training. It is the method of fine tuning the weights of a neural net based on the error rate obtained in the previous iteration. It is a standard method of training artificial neural networks. 

Test: Regression Analysis - Question 2

For a bivariate data set on (x, y), if the means, standard deviations and correlation coefficient are
x̅ = 1.0, y̅ = 2.0, sx = 3.0, sy = 9.0, r = 0.8
Then the regression line of y on x is:

Detailed Solution for Test: Regression Analysis - Question 2

Formula

The regression line of y on x is given as

y - y̅ = r × σy(x - x̅)/σx

Calculation

According to the question

y - 2 = 0.8 × 9(x - 1)/3

⇒ y - 2 = 2.4(x - 1)

∴ y = 2 + 2.4(x - 1)

1 Crore+ students have signed up on EduRev. Have you? Download the App
Test: Regression Analysis - Question 3

If a constant 60 is subtracted from each of the values of X and Y, then the regression coefficient is

Detailed Solution for Test: Regression Analysis - Question 3

The regression coefficient are independent of the change of the origin. But , they are not independent of the change of the scale. It means there will be no effect on the regression coefficient if any constant is subtracted from the values of x and y

∴ After subtracting constant 60 from each value of X and Y, the regression coefficient is not changed.

Test: Regression Analysis - Question 4

The data about the sales and advertisement expenditure of a firm is given below
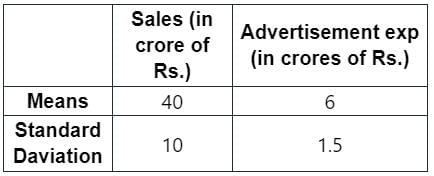
The correlation coefficient between sales and advertisement expenditure is 0.9. The likely sales for a proposed advertisement expenditure of Rs. 10 crore

Detailed Solution for Test: Regression Analysis - Question 4

Given

X̅ = mean of sales = 40

Y̅ = mean of advertisement cost = 6

Formula

Regression equation of X and Y = X - X̅ = r(x/y)(Y - Y̅)

Calculation

⇒ X - 40 = 0.09(10/1.5)(Y - 6)

⇒ X - 40 = (9/1.5)(Y - 6)

⇒ X - 40 = 6(Y - 6)

⇒ X - 40 = 6Y - 36

⇒ X = 6Y + 4

⇒ X = 6(10) + 4

∴ The likely sales for a proposed advertisement expenditure of Rs. 10 crore is 64 crore.

Test: Regression Analysis - Question 5

In Regression Analysis, if a quantitative variable has 'm' categories, one can introduce

Detailed Solution for Test: Regression Analysis - Question 5
  • If a quantitative variable in regression analysis has "m" categories, one can add "m-1" dummy variables to the model. Dummy coding or indicator variable coding are terms used to describe this method.
  • To represent categorical data in a regression model, utilize dummy coding. One category of the original variable is identified as the reference or baseline category, and one binary (dummy) variable is created for each of the other categories. Usually, the category with the lowest or most frequent value is the reference category.

Hence, In Regression Analysis, if a quantitative variable has 'm' categories, one can introduce Only m -1 dummy variables.

Test: Regression Analysis - Question 6

Dimension reduction methods have the goal of using the correlation structure among the predictor variables to accomplish which of the following:

A. To reduce the number of predictor components

B. To help ensure that these components are dependent

C. To provide a framework for interpretability of the results

D. To help ensure that these components are independent

E. To increase the number of predictor components

Choose the correct answer from the options given below: 

Detailed Solution for Test: Regression Analysis - Question 6

 The correct answer is Options A, C, and D only.

  • Option A: Dimension reduction methods are used to reduce the number of predictor components. This is done by identifying the underlying patterns in the data and then representing the data in a lower-dimensional space.
  • Option C: Dimension reduction methods can provide a framework for interpretability of the results. This is because it can help to simplify the data and make it easier to understand the relationships between the variables.
  • Option D: Dimension reduction methods can help to ensure that these components are independent. This is because the goal of dimension reduction is to identify the underlying patterns in the data, and independent components do not share any common patterns.
  • Option B is incorrect because dimension reduction methods do not necessarily ensure that the components are dependent. In fact, the goal of dimension reduction is to identify the underlying patterns in the data, and independent components do not share any common patterns.
  • Option E is incorrect because dimension reduction methods are used to reduce the number of predictor components, not increase them
Test: Regression Analysis - Question 7

Given the regression lines X + 2Y - 5 = 0, 2X + 3Y - 8 = 0 and Var(X) = 12, the value of Var(Y) is

Detailed Solution for Test: Regression Analysis - Question 7

Given

Regression lines

x + 2y - 5 = 0

2x + 3y - 8 = 0

var(x)= σx = 12

Calculation

x + 2y - 5 = 0    ------(i)

Let y = - x/2 + 5/2 be the regression line of y on x [ from equation 1]

2x + 3y - 8

x = -(3/2)y + 8/2 be the regressiopn line of x on y

⇒ bxy = -1/2 and byx = -3/2

bxy = Regression line of y on x

byx = Regression line of x on y

We know that regression coefficient = r = √(byx × bxy)

⇒ r = √(-1/2 × -3/2)

∴ r = √3/2 < 1

σx = 12 = 2√3

We know that byx = r (σyx)

⇒ -1/2 = √3/2 (σy/2√3)

⇒ σy = - 2

∴ var(y) = variance of y =(-2)2 = 4

Test: Regression Analysis - Question 8

For the regression equations

y = 0.516x + 33.73

and

x = 0.512 y + 32.52

the means of x and y are nearly

Detailed Solution for Test: Regression Analysis - Question 8

The given regression equations are:

y = 0.516x + 33.73 ⇒ 0.516 x – y = -33.73

x = 0.512 y + 32.52 ⇒ x – 0.512 y = 32.52

By solving the above two equations, we get

x = 67.6, y = 68.6

Important Points:

The line of regression of y on x is

The line of regression of x on y is

 is called the regression co-efficient of y on x and is denoted by byx

 is called the regression co-efficient of x on y and is denoted by bxy

If the line is in the form of y1 = m1 x1 + c1, then the regression co-efficient byx = m1

If the line is in the form of x2 = y2 m2 + c3, then the regression co-efficient bxy = m2

Correlation co-efficient 

Test: Regression Analysis - Question 9

If x and y are uncorrelated variables then this implies:

Detailed Solution for Test: Regression Analysis - Question 9

If x and y are uncorrelated variables then there can not be any line of regression between them drawn and therefore there is no line of regression relationship between them

∴ Option a is correct

Important Points

The line of regression = The line  y = a + bx  which is fitted  to a set of n points (xi, yi) by the method of least square called line of regression of y on x. similarly if regression x = a + by is fitted to (xi, yi) is called line of regression of x on y

The coefficient of correlation is the GM between the regression coefficient.

Test: Regression Analysis - Question 10

If the two regression lines are as under :

Y = a + bX

X = c + dY

What is the correlation coefficient between variables X and Y?

Detailed Solution for Test: Regression Analysis - Question 10

Y = a + bX

Where, a and b are constants

b = it is called the regression coefficient of Y on X and is denoted by byx. It measures the change in Y corresponding to a unit change in X.

Thus, byx = Slope of the line of regression of Y on X = b

X = c + dY

where, c and d are constants

d = it is called the regression coefficient of X on Y and is denoted by bxy. It measures the change in X corresponding to a unit change in Y.

Thus, bxy = Slope of the line of regression of X on Y = d

Correlation coefficient = √byx bxy

⇒ √bd

Information about Test: Regression Analysis Page
In this test you can find the Exam questions for Test: Regression Analysis solved & explained in the simplest way possible. Besides giving Questions and answers for Test: Regression Analysis, EduRev gives you an ample number of Online tests for practice

Top Courses for Civil Engineering (CE)

Download as PDF

Top Courses for Civil Engineering (CE)