SSC CGL Exam  >  SSC CGL Tests  >  Test: Pie Charts - 2 - SSC CGL MCQ

Test: Pie Charts - 2 - SSC CGL MCQ


Test Description

15 Questions MCQ Test - Test: Pie Charts - 2

Test: Pie Charts - 2 for SSC CGL 2024 is part of SSC CGL preparation. The Test: Pie Charts - 2 questions and answers have been prepared according to the SSC CGL exam syllabus.The Test: Pie Charts - 2 MCQs are made for SSC CGL 2024 Exam. Find important definitions, questions, notes, meanings, examples, exercises, MCQs and online tests for Test: Pie Charts - 2 below.
Solutions of Test: Pie Charts - 2 questions in English are available as part of our course for SSC CGL & Test: Pie Charts - 2 solutions in Hindi for SSC CGL course. Download more important topics, notes, lectures and mock test series for SSC CGL Exam by signing up for free. Attempt Test: Pie Charts - 2 | 15 questions in 15 minutes | Mock test for SSC CGL preparation | Free important questions MCQ to study for SSC CGL Exam | Download free PDF with solutions
Test: Pie Charts - 2 - Question 1

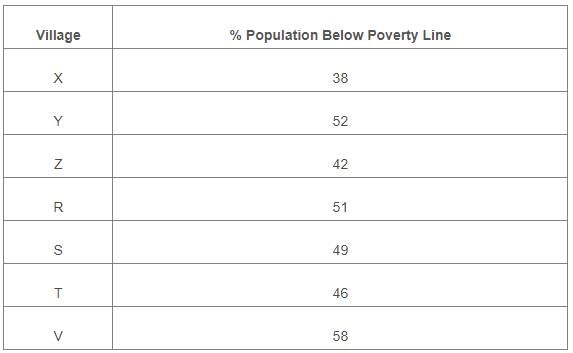
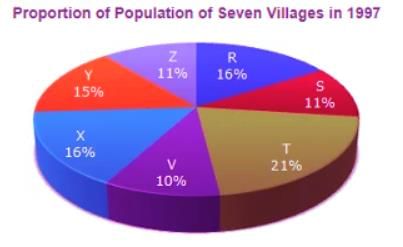
Study the following pie-chart and the table and answer the questions based on them.
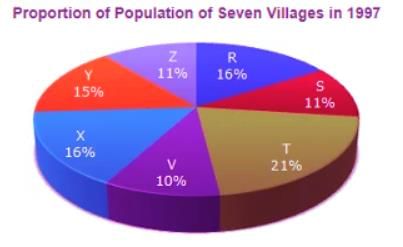
Q. If in 1999, the population of village R increase by 10% while that of village Z reduces by 5% compared to that in 1997 and the percentage of population below poverty line remains unchanged for all the villages, then find the approximate ratio of population of village R below poverty line to the ratio of population of village Z below poverty line for the year 1999.

Detailed Solution for Test: Pie Charts - 2 - Question 1

Let the total population of all the seven village in 1997 be N.
Then, population of village R in 1997
= 16% of N = 16N/100
and population of village Z in 1997
= 11% of N = 11N/100
Population of village R in 1999 
= { 16N/100 + (10% of 16N/100) }
= 1760N/10000
and population of village Z in 1999
= { 11N/100 - (5% of 11N/100)}
= 1045N/10000
Now, population of village R below poverty line for 1999
= 51% of 1760N/10000 
and population of village Z below poverty line for 1999
= 42% of  1045N/10000 
= 51% of (1760N/10000) / 42% of (1045N/10000)

= 2/1

Test: Pie Charts - 2 - Question 2

Study the following pie-chart and the table and answer the questions based on them.
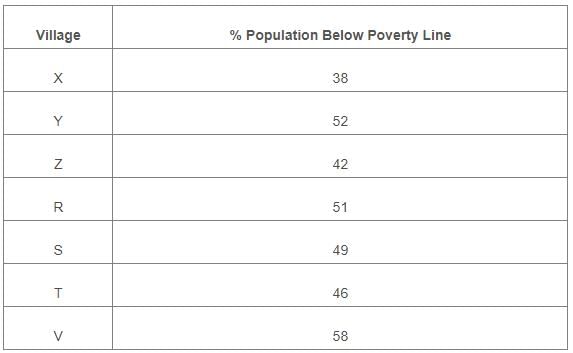
Q. If in 1998, the population of village Y and V increase by 10% each and the percentage of population below poverty line remains unchanged for all the villages, then find the population of village V below poverty line in 1998, given that the population of village Y in 1997 was 30000.

Detailed Solution for Test: Pie Charts - 2 - Question 2

Population of village Y in 1997 = 30000 (given).

Let the population of village V in 1997 be v.

Then, 15 : 10 = 30000 : v   =>  

15
= 20000.

Now, population of village V in 1998 

= 20000 + (10% of 20000) = 22000.

Therefore Population of village V below poverty line in 1998 

= 58% of 22000 = 12760.

1 Crore+ students have signed up on EduRev. Have you? Download the App
Test: Pie Charts - 2 - Question 3

Study the following pie-chart and the table and answer the questions based on them.
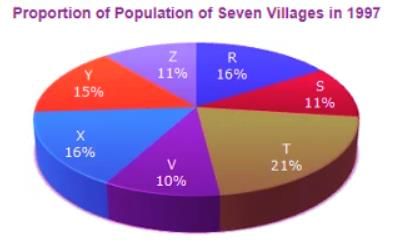
Q. If the population of village R in 1997 is 32000, then what will be the population of village Y below poverty line in that year?

Detailed Solution for Test: Pie Charts - 2 - Question 3

Population of village R = 32000 (given).

Let the population of village Y be y.

Then, 16 : 15 = 32000 : y 
= 30000.

∴ Population of village Y below poverty line 

= 52% of 30000 = 15600

Test: Pie Charts - 2 - Question 4

Study the following pie-chart and the table and answer the questions based on them.
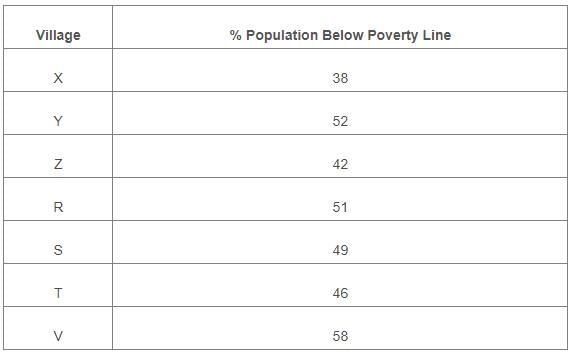
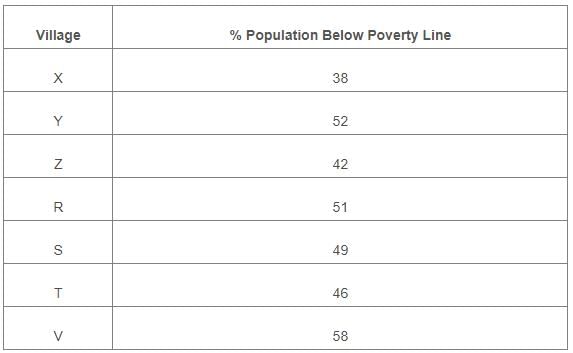
Q. The ratio of population of village T below poverty line to that of village Z below poverty line in 1997 is:

Detailed Solution for Test: Pie Charts - 2 - Question 4

Let N be the total population of all the seven villages.

Then, population of village T below poverty line 

= 46% of (21% of N)

and Population of villages Z below the poverty line

 = 42% of (11% of N)

= 23/11.

Test: Pie Charts - 2 - Question 5

Study the following pie-chart and the table and answer the questions based on them.
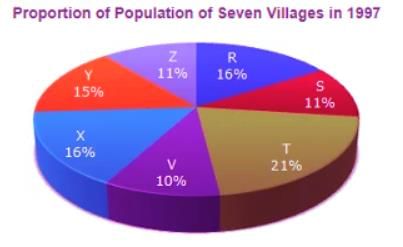
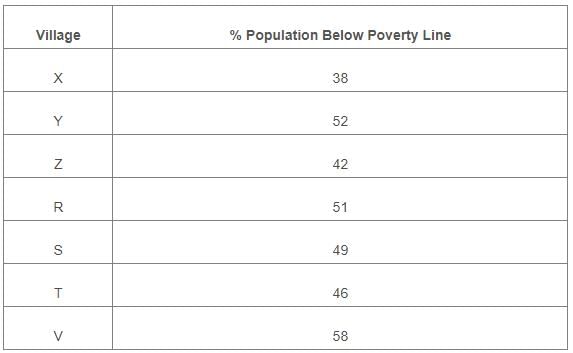
Q. Find the population of village S if the population of village X below poverty line in 1997 is 12160.

Detailed Solution for Test: Pie Charts - 2 - Question 5

Let the population of village X be x.

Then, 38% of x = 12160 
= 32000.
Now, if s be the population of village S, then
16 : 11 = 32000 : s ⇒ s =

Test: Pie Charts - 2 - Question 6

Study the following graph carefully and answer the questions given below:
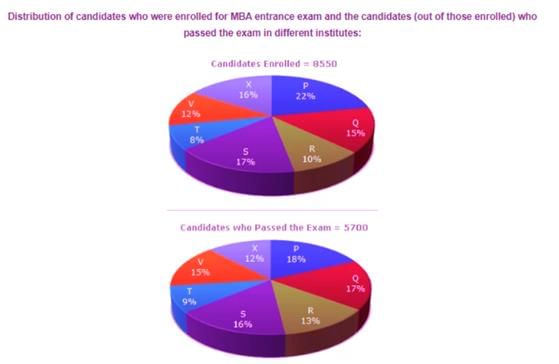
Q. The number of candidates passed from institute S and P together exceeds the number of candidates enrolled from institute T and R together by:

Detailed Solution for Test: Pie Charts - 2 - Question 6

Required difference:

= [(16% + 18%) of 5700] - [(8% + 10%) of 8550

= [(34% of 5700) - (18% of 8550)]

= (1938 - 1539)

= 399

Test: Pie Charts - 2 - Question 7

Study the following graph carefully and answer the questions given below:
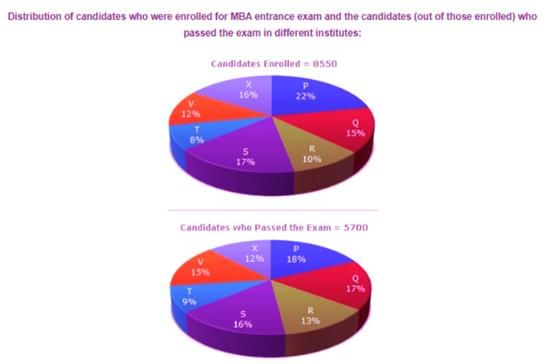
Q. What is the percentage of candidates passed to the candidates enrolled for institutes Q and R together?

Detailed Solution for Test: Pie Charts - 2 - Question 7

Candidates passed from institutes Q and R together
= [(13% + 17%) of 5700]
= 30% of 5700.
Candidates enrolled from institute Q and R together
= [(15% + 10%) of 8550]
= 25% of 8550.
Required Percentage    


= 80%

Test: Pie Charts - 2 - Question 8

Study the following graph carefully and answer the questions given below:
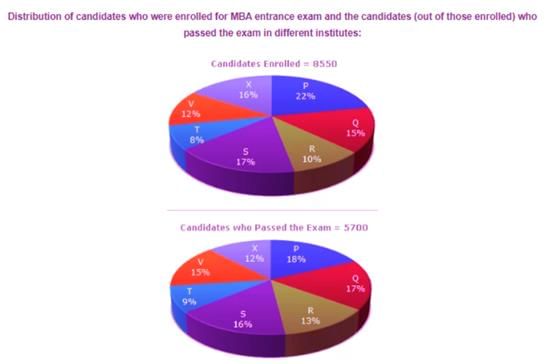
Q. Which institute has the highest percentage of candidates passed to the candidates enrolled?

Detailed Solution for Test: Pie Charts - 2 - Question 8

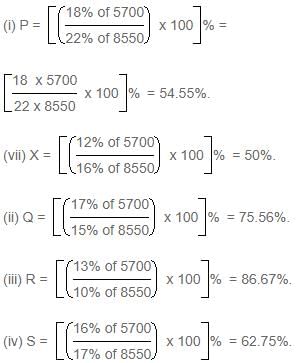
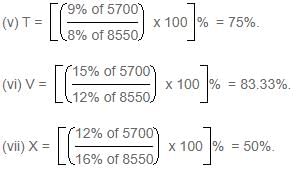
The percentage of candidates passed to candidates enrolled can be determined for each institute as under:


Highest of these is 86.67% corresponding to institute R.

Test: Pie Charts - 2 - Question 9

Study the following graph carefully and answer the questions given below:
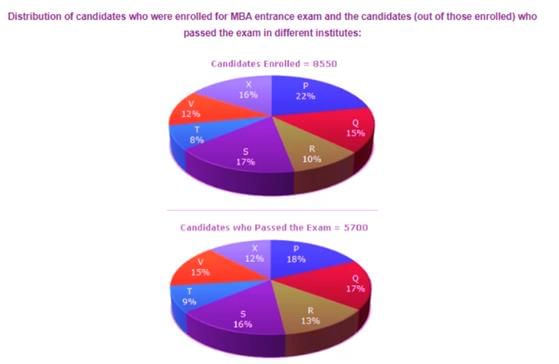
Q. What is the ratio of candidates passed to the candidates enrolled from institute P?

Detailed Solution for Test: Pie Charts - 2 - Question 9

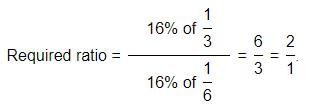
Required ratio = 

Test: Pie Charts - 2 - Question 10

Study the following graph carefully and answer the questions given below:
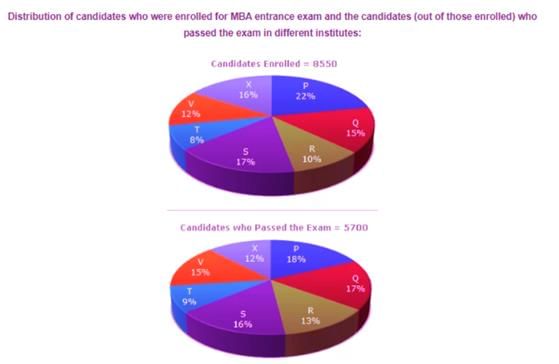
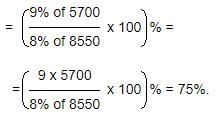
Q. What percentage of candidates passed the Exam from institute T out of the total number of candidates enrolled from the same institute?

Detailed Solution for Test: Pie Charts - 2 - Question 10

Required percentage

Test: Pie Charts - 2 - Question 11

Study the following pie-diagrams carefully and answer the questions given below it:
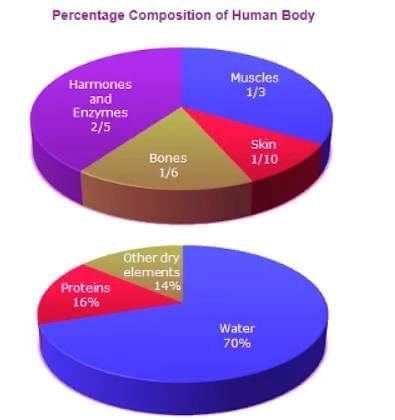
Q. To show the distribution of proteins and other dry elements in the human body, the arc of the circle should subtend at the centre an angle of:

Detailed Solution for Test: Pie Charts - 2 - Question 11

Percentage of proteins and other dry elements in the body

=(16% + 14%)

= 30%

Central angle corresponding to proteins and other dry elements together

= 30% of 360º

= 108º.

Test: Pie Charts - 2 - Question 12

Study the following pie-diagrams carefully and answer the questions given below it:
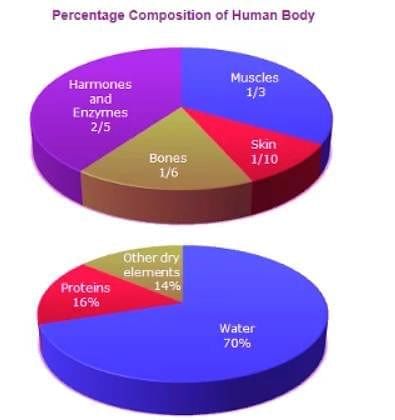
Q. What percent of the total weight of human body is equivalent to the weight of the proteins in skin in human body?

Detailed Solution for Test: Pie Charts - 2 - Question 12

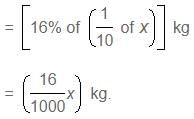
Let the body weight be x kg.

Then, weight of skin protein in the body

Test: Pie Charts - 2 - Question 13

Study the following pie-diagrams carefully and answer the questions given below it:
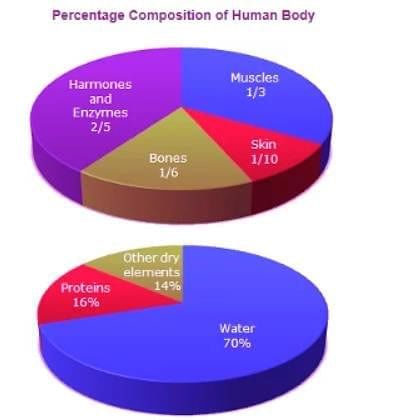
Q. What will be the quantity of water in the body of a person weighing 50 kg?

Detailed Solution for Test: Pie Charts - 2 - Question 13

Quantity of water in the body of a person weighing 50 kg

= (70% of 50)

= 35 kg

Test: Pie Charts - 2 - Question 14

Study the following pie-diagrams carefully and answer the questions given below it:
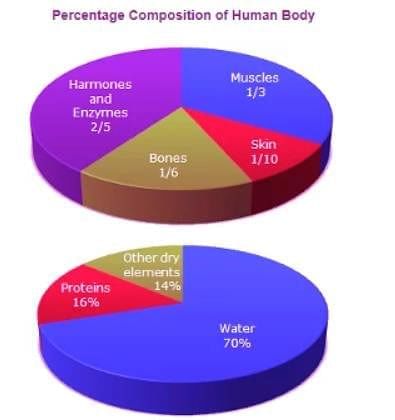
Q. What is the ratio of the distribution of proteins in the muscles to that of the distribution of proteins in the bones?

Detailed Solution for Test: Pie Charts - 2 - Question 14

Test: Pie Charts - 2 - Question 15

Study the following pie-diagrams carefully and answer the questions given below it:
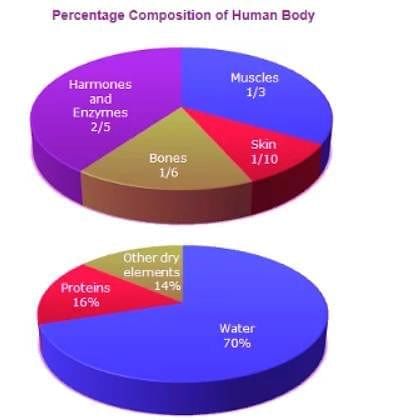
Q. In the human body, what part is made of neither bones nor skin?

Detailed Solution for Test: Pie Charts - 2 - Question 15

Part of the body made of neither bones nor skin
= 1 - (1 + 1) = 11.61015

Information about Test: Pie Charts - 2 Page
In this test you can find the Exam questions for Test: Pie Charts - 2 solved & explained in the simplest way possible. Besides giving Questions and answers for Test: Pie Charts - 2, EduRev gives you an ample number of Online tests for practice

Top Courses for SSC CGL

Download as PDF

Top Courses for SSC CGL