SSC CGL Exam  >  SSC CGL Tests  >  MCQ: Bar Charts - 1 - SSC CGL MCQ

MCQ: Bar Charts - 1 - SSC CGL MCQ


Test Description

15 Questions MCQ Test - MCQ: Bar Charts - 1

MCQ: Bar Charts - 1 for SSC CGL 2024 is part of SSC CGL preparation. The MCQ: Bar Charts - 1 questions and answers have been prepared according to the SSC CGL exam syllabus.The MCQ: Bar Charts - 1 MCQs are made for SSC CGL 2024 Exam. Find important definitions, questions, notes, meanings, examples, exercises, MCQs and online tests for MCQ: Bar Charts - 1 below.
Solutions of MCQ: Bar Charts - 1 questions in English are available as part of our course for SSC CGL & MCQ: Bar Charts - 1 solutions in Hindi for SSC CGL course. Download more important topics, notes, lectures and mock test series for SSC CGL Exam by signing up for free. Attempt MCQ: Bar Charts - 1 | 15 questions in 15 minutes | Mock test for SSC CGL preparation | Free important questions MCQ to study for SSC CGL Exam | Download free PDF with solutions
MCQ: Bar Charts - 1 - Question 1

Direction: A cosmetic company provides five different products. The sales of these five products (in lakh number of packs) during 1995 and 2000 are shown in the following bar graph.
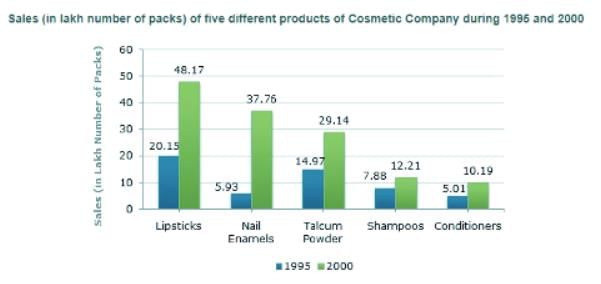
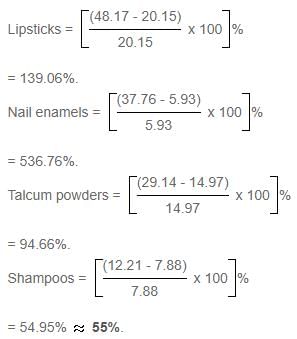
Q. What is the approximate ratio of the sales of nail enamels in 2000 to the sales of Talcum powders in 1995?

Detailed Solution for MCQ: Bar Charts - 1 - Question 1

MCQ: Bar Charts - 1 - Question 2

Direction: A cosmetic company provides five different products. The sales of these five products (in lakh number of packs) during 1995 and 2000 are shown in the following bar graph.
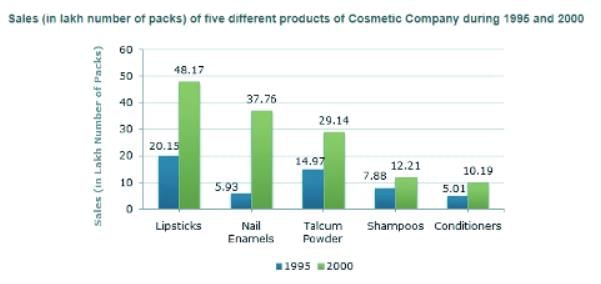
Q. The sales of conditioners in 1995 was by what percent less than the sales of shampoos in 1995? (rounded off to nearest integer)

Detailed Solution for MCQ: Bar Charts - 1 - Question 2

Required percentage

= 36.42%
≈ 36%.

1 Crore+ students have signed up on EduRev. Have you? Download the App
MCQ: Bar Charts - 1 - Question 3

Direction: A cosmetic company provides five different products. The sales of these five products (in lakh number of packs) during 1995 and 2000 are shown in the following bar graph.

Q. During the period 1995-2000, the minimum rate of increase in sales is in the case of?

Detailed Solution for MCQ: Bar Charts - 1 - Question 3

The percentage increase from 1995 to 2000 for various products are:

∴ The minimum rate of increase in sales from 1995 to 2000 is in the case of Shampoos.

MCQ: Bar Charts - 1 - Question 4

Direction: A cosmetic company provides five different products. The sales of these five products (in lakh number of packs) during 1995 and 2000 are shown in the following bar graph.

Q. The sales of lipsticks in 2000 was by what percent more than the sales of nail enamels in 2000? (rounded off to nearest integer)

Detailed Solution for MCQ: Bar Charts - 1 - Question 4

Required percentage

= 27.57%
≈ 28%.

MCQ: Bar Charts - 1 - Question 5

Direction: A cosmetic company provides five different products. The sales of these five products (in lakh number of packs) during 1995 and 2000 are shown in the following bar graph.

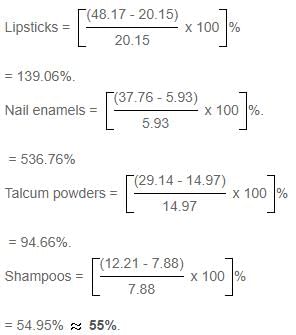
Q. The sales have increase by nearly 55% from 1995 to 2000 in the case of?

Detailed Solution for MCQ: Bar Charts - 1 - Question 5

The percentage increase from 1995 to 2000 for various products are:

MCQ: Bar Charts - 1 - Question 6

Direction: The bar graph given below shows the percentage distribution of the total production of a car manufacturing company into various models over two years. Study the graph carefully and answer the questions that follow.
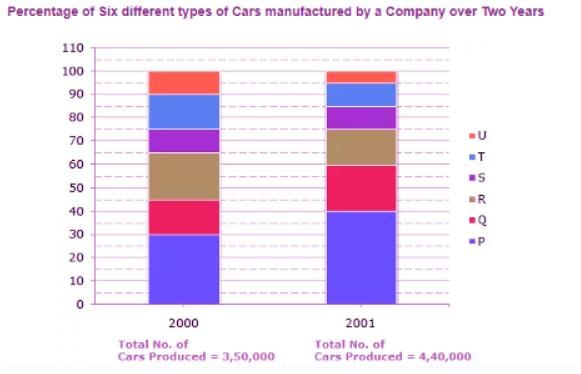
Q. What was the difference in the number of Q type cars produced in 2000 and that produced in 2001?

Detailed Solution for MCQ: Bar Charts - 1 - Question 6

Total number of Q type cars produced in 2001

=(60 - 40)% of 4,40,000 = 88,000.

Total number of Q type cars produced in 2000

=(45 - 30)% of 3,50,000 = 52,500.

∴ Therefore Required difference = (88000 - 52500) = 35,500.

MCQ: Bar Charts - 1 - Question 7

Direction: The bar graph given below shows the percentage distribution of the total production of a car manufacturing company into various models over two years. Study the graph carefully and answer the questions that follow.
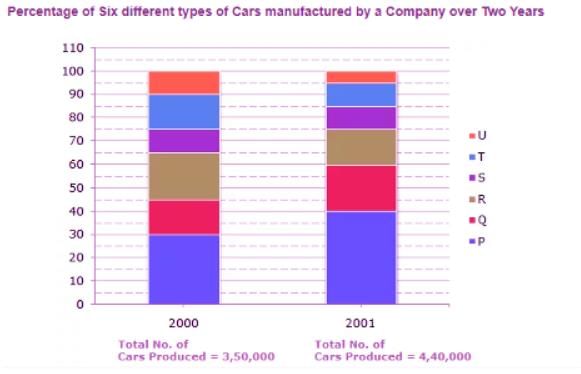
Q. If the percentage production of P type cars in 2001 was the same as that in 2000, then the number of P type cars produced in 2001 would have been?

Detailed Solution for MCQ: Bar Charts - 1 - Question 7

If the percentage production of P type cars in 2001

= Percentage production of P type cars in 2000

= 30%.

then, number of P type cars produced in 2001

= 30% of 4,40,000

= 1,32,000.

MCQ: Bar Charts - 1 - Question 8

Direction: The bar graph given below shows the percentage distribution of the total production of a car manufacturing company into various models over two years. Study the graph carefully and answer the questions that follow.
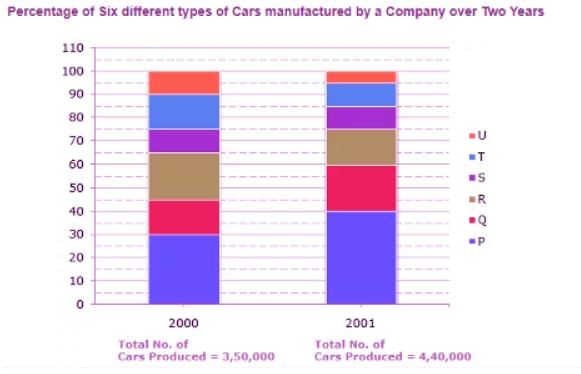
Q. If 85% of the S type cars produced in each year were sold by the company, how many S type cars remain unsold?

Detailed Solution for MCQ: Bar Charts - 1 - Question 8

Number of S type cars which remained unsold in 2000 = 15% of 35,000

and number of S type cars which remained unsold in 2001 = 15% of 44,000.

Therefore Total number of S type cars which remained unsold

= 15% of (35,000 + 44,000)

= 15% of 79,000

= 11,850.

MCQ: Bar Charts - 1 - Question 9

Direction: The bar graph given below shows the percentage distribution of the total production of a car manufacturing company into various models over two years. Study the graph carefully and answer the questions that follow.
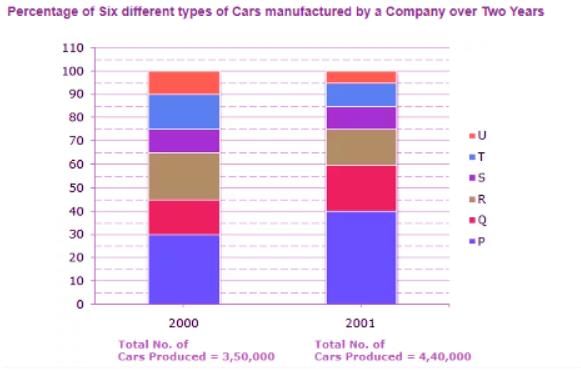
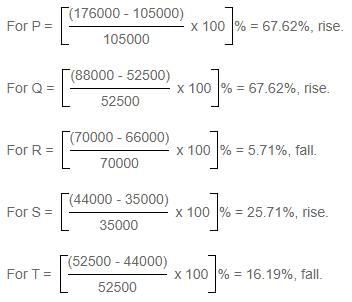
Q. For which model the percentage rise/fall in production from 2000 to 2001 was minimum?

Detailed Solution for MCQ: Bar Charts - 1 - Question 9

The percentage change (rise/fall) in production from 2000 to 2001 for various models is:

∴ Minimum percentage rise/fall is production is the case of model R.

MCQ: Bar Charts - 1 - Question 10

Direction: The bar graph given below shows the percentage distribution of the total production of a car manufacturing company into various models over two years. Study the graph carefully and answer the questions that follow.
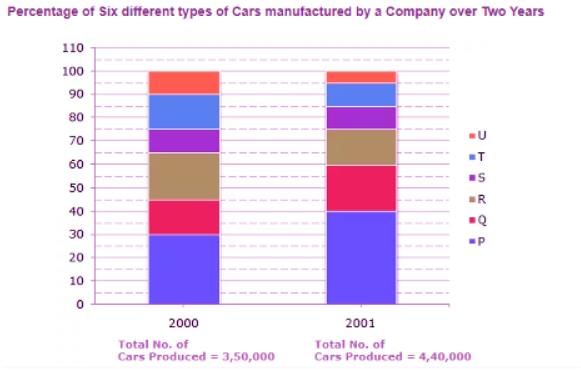
Q. Total number of cars of models P, Q and T manufactured in 2000 is?

Detailed Solution for MCQ: Bar Charts - 1 - Question 10

Analysis of the graph:

We shall first determine the number of cars of each model produced by the Company during the two years:

In 2000: Total number of cars produced = 3,50,000.

P = (30 - 0)% of 3,50,000 = 30% of 3,50,000 = 1,05,000.

Q = (45 - 30)% of 3,50,000 = 15% of 3,50,000 = 52,500.

R = (65 - 45)% of 3,50,000 = 20% of 3,50,000 = 70,000.

S = (75 - 65)% of 3,50,000 = 10% of 3,50,000 = 35,000.

T = (90 - 75)% of 3,50,000 = 15% of 3,50,000 = 52,500.

U = (100 - 90)% of 3,50,000 = 10% of 3,50,000 = 35,000.

In 2001: Total number of cars produced = 4,40,000.

P = (40 - 0)% of 4,40,000 = 40% of 4,40,000 = 1,76,000.

Q = (60 - 40)% of 4,40,000 = 20% of 4,40,000 = 88,000.

R = (75 - 60)% of 4,40,000 = 15% of 4,40,000 = 66,000.

S = (85 - 75)% of 4,40,000 = 10% of 4,40,000 = 44,000.

T = (95 - 85)% of 4,40,000 = 10% of 4,40,000 = 44,000.

U = (100 - 95)% of 4,40,000 = 5% of 4,40,000 = 22,000.

Total number of cars of models P, Q and T manufacture in 2000

= (105000 + 52500 + 52500)

= 2,10,000.

MCQ: Bar Charts - 1 - Question 11

Direction: A soft drink company prepares drinks of three different flavours - X, Y and Z. The production of three flavours over a period of six years has been expressed in the bar graph provided below. Study the graph and answer the questions based on it.
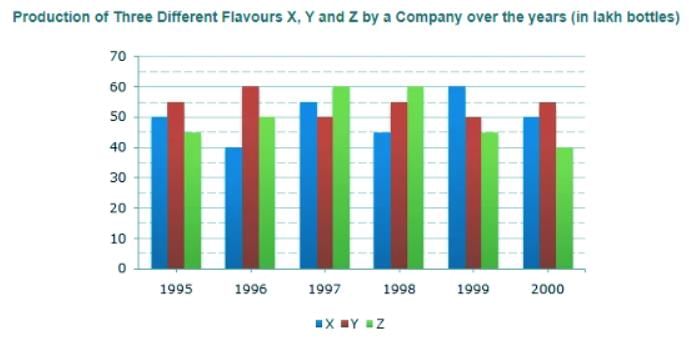
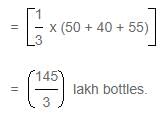
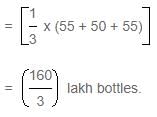
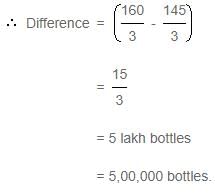
Q. What is the difference between the average production of flavour X in 1995, 1996 and 1997 and the average production of flavour Y in 1998, 1999 and 2000?

Detailed Solution for MCQ: Bar Charts - 1 - Question 11

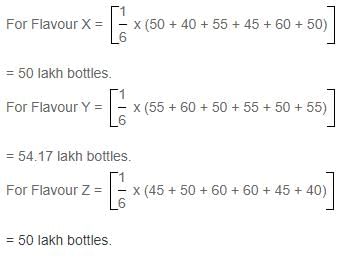
Average production of flavour X in 1995, 1996 and 1997

Average production of flavour Y in 1998, 1999 and 2000

MCQ: Bar Charts - 1 - Question 12

Direction: A soft drink company prepares drinks of three different flavours - X, Y and Z. The production of three flavours over a period of six years has been expressed in the bar graph provided below. Study the graph and answer the questions based on it.
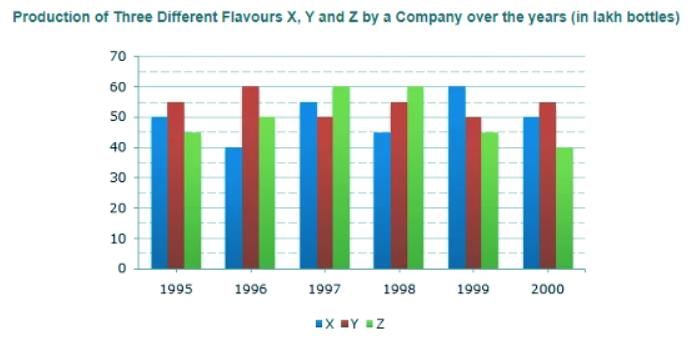
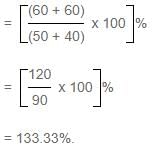
Q. The total production of flavour Z in 1997 and 1998 is what percentage of the total production of flavour X in 1995 and 1996?

Detailed Solution for MCQ: Bar Charts - 1 - Question 12

Required percentage

MCQ: Bar Charts - 1 - Question 13

Direction: A soft drink company prepares drinks of three different flavours - X, Y and Z. The production of three flavours over a period of six years has been expressed in the bar graph provided below. Study the graph and answer the questions based on it.
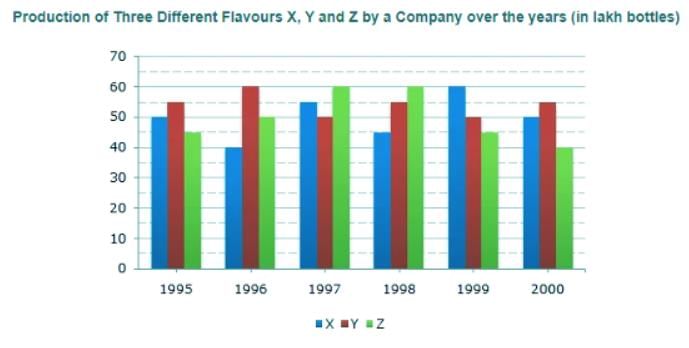
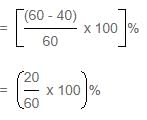
Q. What was the approximate decline in the production of flavour Z in 2000 as compared to the production in 1998?

Detailed Solution for MCQ: Bar Charts - 1 - Question 13

Percentage decline in the production of flavour Z in 2000 as compared to the production in 1998

= 33.33%
≈ 33%.

MCQ: Bar Charts - 1 - Question 14

Direction: A soft drink company prepares drinks of three different flavours - X, Y and Z. The production of three flavours over a period of six years has been expressed in the bar graph provided below. Study the graph and answer the questions based on it.
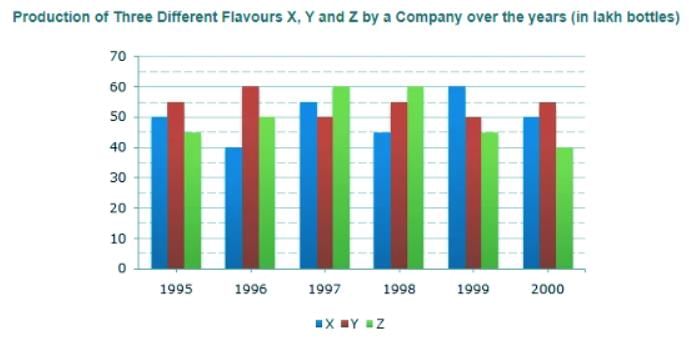
Q. For which flavour was the average annual production maximum in the given period?

Detailed Solution for MCQ: Bar Charts - 1 - Question 14

Average annual productions over the given period for various flavours are:

∴ Maximum average production is for Flavour Y.

MCQ: Bar Charts - 1 - Question 15

Direction: A soft drink company prepares drinks of three different flavours - X, Y and Z. The production of three flavours over a period of six years has been expressed in the bar graph provided below. Study the graph and answer the questions based on it.
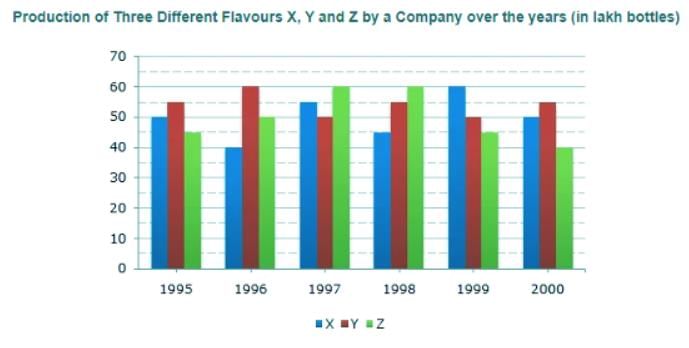
Q. For which of the following years the percentage of rise/fall in production from the previous year is the maximum for the flavour Y?

Detailed Solution for MCQ: Bar Charts - 1 - Question 15

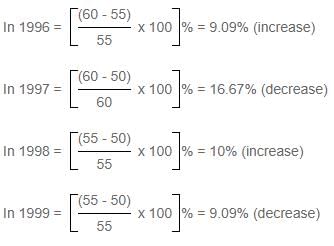
The percentage rise/fall in production from the previous year for flavour Y during various years are:

∴ Maximum change is decrease of 16.67% during 1997.

Information about MCQ: Bar Charts - 1 Page
In this test you can find the Exam questions for MCQ: Bar Charts - 1 solved & explained in the simplest way possible. Besides giving Questions and answers for MCQ: Bar Charts - 1, EduRev gives you an ample number of Online tests for practice
Download as PDF