CUET Exam  >  CUET Tests  >  Test: Bar Graphs - CUET MCQ

Test: Bar Graphs - CUET MCQ


Test Description

15 Questions MCQ Test - Test: Bar Graphs

Test: Bar Graphs for CUET 2024 is part of CUET preparation. The Test: Bar Graphs questions and answers have been prepared according to the CUET exam syllabus.The Test: Bar Graphs MCQs are made for CUET 2024 Exam. Find important definitions, questions, notes, meanings, examples, exercises, MCQs and online tests for Test: Bar Graphs below.
Solutions of Test: Bar Graphs questions in English are available as part of our course for CUET & Test: Bar Graphs solutions in Hindi for CUET course. Download more important topics, notes, lectures and mock test series for CUET Exam by signing up for free. Attempt Test: Bar Graphs | 15 questions in 20 minutes | Mock test for CUET preparation | Free important questions MCQ to study for CUET Exam | Download free PDF with solutions
Test: Bar Graphs - Question 1

What was the increase in registration of vehicles other than Cars from January to April 1991?

Detailed Solution for Test: Bar Graphs - Question 1

No. of other vehicles registered in January 1991
= 27 - 21
= 6 thousand
No. of other vehicles registered in April 1991
= 35 - 20
= 15 thousand
Hence, increased
= 15 - 6
= 9 thousand

Test: Bar Graphs - Question 2

What is the difference between the number of cars registered in January and those registered in June?

Detailed Solution for Test: Bar Graphs - Question 2

Registered increase
= 28 - 21
= 7 thousand

1 Crore+ students have signed up on EduRev. Have you? Download the App
Test: Bar Graphs - Question 3

Which was the following month was the registration of vehicles other than Cars maximum?

Detailed Solution for Test: Bar Graphs - Question 3

No. of vehicles registered in May
= 35 - 17
= 18 is maximum in all.

Test: Bar Graphs - Question 4

What was the number of vehicles other than Cars registered in March, 1991?

Detailed Solution for Test: Bar Graphs - Question 4

No. of vehicles registered in March 1991
= 25 - 15
= 10 thousand

Test: Bar Graphs - Question 5

What was the percentage increase in registration of Cars from February to March 1991?

Detailed Solution for Test: Bar Graphs - Question 5

Registered % increase

Test: Bar Graphs - Question 6

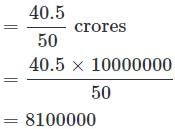
Per year increase in population from the year 1951 to 2001 is

Detailed Solution for Test: Bar Graphs - Question 6

Total increase
  = 68.40 - 27.90
  = 40.5 crores
  Hence, annual increase

Test: Bar Graphs - Question 7

In which census year, the per cent increase in population is least as compared to that in the previous census year?

Detailed Solution for Test: Bar Graphs - Question 7

% increase in 1971
= [(36.14 × 31.85) × 100]
= 13.47% least in all

Test: Bar Graphs - Question 8

In which census year, the per cent increase in population is highest as compared to that in the previous census year?

Detailed Solution for Test: Bar Graphs - Question 8

Percentage increase in 2001 = 24.8

Test: Bar Graphs - Question 9

The percent increase in population from 1991 to 2001 is:

Detailed Solution for Test: Bar Graphs - Question 9

Increase in Population
= 68.40 - 54.80
= 13.6 crores

Test: Bar Graphs - Question 10

How many Naya mixer-grinder disposed off by end of 2000 ?

Detailed Solution for Test: Bar Graphs - Question 10

In the year 1998, (75 - 25) = 50 mixer-grinder purchased.
Then, In 2000, 20% of 50 disposed off = 10.
Similarly, number of mixer grinder purchased in 1997 is 25.
Number of mixer-grinder disposed in 1999 = 20% of 25 = 5.
Total number of mixer-grinder disposed off at end of 2000
= 10 + 5
= 15

Test: Bar Graphs - Question 11

Which region showed the highest growth in number of households in all the income categories for the period ?

Detailed Solution for Test: Bar Graphs - Question 11

From graph it is clear that southern region showed the highest growth in number of households in all the income categories for the period.

Test: Bar Graphs - Question 12

What was the total household income in northern region for upper-middle class?

Detailed Solution for Test: Bar Graphs - Question 12

Region wise breakup is not available. hence, question cannot be answered.

Test: Bar Graphs - Question 13

What is the percentage increase in total number of households for the northern region (upper-middle) over the given period ?

Detailed Solution for Test: Bar Graphs - Question 13

The percentage increase in total number of households for the northern region for upper-middle income category is 200%.

Test: Bar Graphs - Question 14

What was the average income of the high-income group in 1987-88?

Detailed Solution for Test: Bar Graphs - Question 14

It is clear from the table average income is Rs. 75,000.

Test: Bar Graphs - Question 15

If the price of B is Rs. 125 per unit, what is the sales revenue in the same year due to sale of B (in Rupees Lakhs)?

Detailed Solution for Test: Bar Graphs - Question 15

Assume the total production of the first year as 10000, second year becomes 12000, third year 14400 and fourth year 17280.
Then,
0.2 × 17280 - 0.2 × 12000 = 1056
But this difference is given as 2640. Hence, the value of production will be; 25000, 30000, 36000, and 43200 respectively for the 4 years.
∴ Revenue
= 125 × 0.4 × 30000
= 1500000

Information about Test: Bar Graphs Page
In this test you can find the Exam questions for Test: Bar Graphs solved & explained in the simplest way possible. Besides giving Questions and answers for Test: Bar Graphs, EduRev gives you an ample number of Online tests for practice

Top Courses for CUET

Download as PDF

Top Courses for CUET