ACT Exam  >  ACT Tests  >  Test: ACT Earth Sciences Data Representation Questions - ACT MCQ

Test: ACT Earth Sciences Data Representation Questions - ACT MCQ


Test Description

10 Questions MCQ Test - Test: ACT Earth Sciences Data Representation Questions

Test: ACT Earth Sciences Data Representation Questions for ACT 2024 is part of ACT preparation. The Test: ACT Earth Sciences Data Representation Questions questions and answers have been prepared according to the ACT exam syllabus.The Test: ACT Earth Sciences Data Representation Questions MCQs are made for ACT 2024 Exam. Find important definitions, questions, notes, meanings, examples, exercises, MCQs and online tests for Test: ACT Earth Sciences Data Representation Questions below.
Solutions of Test: ACT Earth Sciences Data Representation Questions questions in English are available as part of our course for ACT & Test: ACT Earth Sciences Data Representation Questions solutions in Hindi for ACT course. Download more important topics, notes, lectures and mock test series for ACT Exam by signing up for free. Attempt Test: ACT Earth Sciences Data Representation Questions | 10 questions in 40 minutes | Mock test for ACT preparation | Free important questions MCQ to study for ACT Exam | Download free PDF with solutions
Test: ACT Earth Sciences Data Representation Questions - Question 1

The chart below depicts the average rainfall by location on the Earth.  Zero degrees latitude corresponds to the equator.  Positive latitudes are north of the equator, while negative latitudes are south of the equator.  A latitude with a magnitude of 90 degrees correlates with one of Earth's poles.
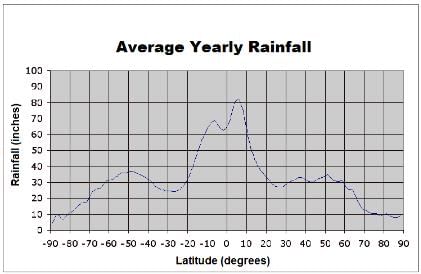
Which best describes the rainfall trend between thirty and sixty degrees latitude?

Detailed Solution for Test: ACT Earth Sciences Data Representation Questions - Question 1

Examining the curve of the graph between 20 and 60 degrees, we see that, even though there is slight variation, rainfall hovers around 30 inches.  Therefore, we can conclude that these latitudes experiences equal approximate rainfall.  

Test: ACT Earth Sciences Data Representation Questions - Question 2

The chart below depicts the average rainfall by location on the Earth.  Zero degrees latitude corresponds to the equator.  Positive latitudes are north of the equator, while negative latitudes are south of the equator.  A latitude with a magnitude of 90 degrees correlates with one of Earth's poles.
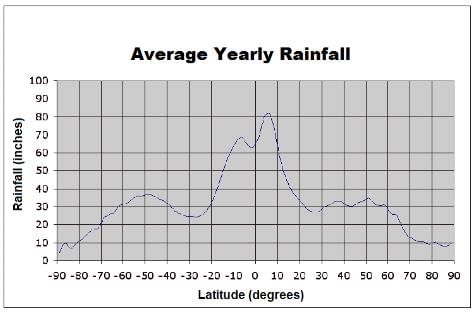
The Tropic of Capricorn is about 23.5 degrees south of the equator. Approximately how many more inches of rain does this latitude experience than the North Pole?

Detailed Solution for Test: ACT Earth Sciences Data Representation Questions - Question 2

To find out the difference in amount of rainfall between these two latitudes, locate −23.5 degrees on the x-axis and find the corresponding amount of rainfall on the y-axis (25 inches).  Next, find the latitude of the North Pole (90 degrees) and its corresponding amount of rainfall (10 inches).  Finally, subtract the two to find how much more rain the Tropic of Capricorn receives:  25−10 = 15 in

1 Crore+ students have signed up on EduRev. Have you? Download the App
Test: ACT Earth Sciences Data Representation Questions - Question 3

A scientist has observed a new planet, Planet H. It was discovered that Planet H has water on its surface. As a result, it is being investigated to determine if it is possible for Planet H to sustain human life. Futhermore, observations revealed that Planet H has four moons: Moon J, Moon K, Moon L, and Moon M. Each moon's radius, distance to Planet H, and time to orbit Planet H have been recorded in the provided table. 

On Earth the moon has a large effect on ocean tides. If it was found that the moons have a tidal affect on Planet H, then which of Planet H's moons would have the largest affect on its oceans? 

Detailed Solution for Test: ACT Earth Sciences Data Representation Questions - Question 3

It is not stated what causes moons to affect the tides on the planet's oceans. The mass of the moon, radius of the moon and distance from Planet H to each moon could impact the affect on the oceans due to the moons. However, it is not stated how each parameter will affect each moon's impact on the tides on Planet H. For example, the mass of the moon could be the largest determining factor or the distance from planet H to each moon could be the largest determining factor on the impact of each moon's affect on the tides. Therefore, the answer cannot be determined from the given information.

Test: ACT Earth Sciences Data Representation Questions - Question 4

Researchers have discovered a new planet, Planet Z. This planet is orbited by several comets, A, B, C and D. Researchers have calculated the time it takes each comet to orbit Planet Z, the closest the comet gets to Planet Z and the diameter of the comet.

What is the relationship between comet diameter and orbit time? 

Detailed Solution for Test: ACT Earth Sciences Data Representation Questions - Question 4

Comet A has the largest diameter at 11.3km and the longest orbit time at 82.3 years. This suggests a direct relationship. Comet B has the shortest diameter of 5.2km and the shortest orbit time at 47.8 years. This also suggests a direct relationship and this trend can be seen in the other two comets. The correct answer is the larger the diameter, the longer the orbit time.

Test: ACT Earth Sciences Data Representation Questions - Question 5

Researchers have discovered a new planet, Planet Z. This planet is orbited by several comets, A, B, C and D. Researchers have calculated the time it takes each comet to orbit Planet Z, the closest the comet gets to Planet Z and the diameter of the comet.

Another comet that orbits Planet Z was found and the comet has a diameter of 4.6km. Which of the following would be the best estimate of orbit time around Planet Z in Earth years?

Detailed Solution for Test: ACT Earth Sciences Data Representation Questions - Question 5

It can be seen in the data that the smaller the diameter, the shorter the orbit time of each comet. The smallest comet previously observed was Comet B that had a diameter of 5.2km and an orbit time of 47.8 years. Since the new found comet has a smaller diameter than Comet B, it should be estimated that the new comet has a shorter orbit time than Comet B. In other words, the new comet's orbit time should be less than 47.8 years. The correct answer is 41.3 years.

Test: ACT Earth Sciences Data Representation Questions - Question 6

Scientists have recorded data in Region A, Region B, Region C and Region D. The data collected include the average daily temperature, the annual rainfall for the past year and the number of fresh water reservoirs. The scientists want to perform an experiment on wild life migration patterns. 

What is the relationship between average annual temperature and the number of fresh water reservoirs? 

Detailed Solution for Test: ACT Earth Sciences Data Representation Questions - Question 6

Region A has the highest average temperature at 102.4 Fahrenheit, while Region C has the lowest average temperature at 0.4 Fahrenheit. Both of these regions have zero fresh water reservoirs. Since Region A has the highest temperature with zero reservoirs and Region C has the lowest temperature with zero reservoirs there is no clear relationship between the temperature and number of fresh water reservoirs in given data. 

Test: ACT Earth Sciences Data Representation Questions - Question 7

Scientists have recorded data in Region A, Region B, Region C and Region D. The data collected include the average daily temperature, the annual rainfall for the past year and the number of fresh water reservoirs. The scientists want to perform an experiment on wild life migration patterns.

If another region was found to have 20 fresh water reservoirs, what could be the amount of annual rainfall for that region in inches? 

Detailed Solution for Test: ACT Earth Sciences Data Representation Questions - Question 7

There is a trend in the data between the number of fresh water reservoirs and annual rainfall. As the amount of annual rainfall increases, so does the number of fresh water reservoirs. In Region B the annual rainfall was 51.3 inches and has the most reservoirs with 16. Since we are looking at region with 20 reservoirs and there is a direct relationship, the possible amount of annual rainfall must be larger than 51.3 inches. The correct answer is 64.3 inches. Note that Region C has more rainfall than Region A, but both have zero fresh water reservoirs. This can be do to that fact that there may be a minimum value of annual rainfall to maintain a fresh water reservoir.

Test: ACT Earth Sciences Data Representation Questions - Question 8

In a specific region, a scientist recorded the rainfall, in inches, during the months of May, June, July and August. The scientist recorded this data in the same spot each month over four years. The purpose of this study was to see how the new factories built in the area impacted the rainfall in that location. 

How have the factories impacted the rainfall that was recorded each year?

Detailed Solution for Test: ACT Earth Sciences Data Representation Questions - Question 8

It is true that the rainfall recorded increases each year. However there is nothing that indicates what is causing this increase. Furthermore it is not noted when the factories were built so it is not possible to determine how the factories affected the rainfall. The answer cannot be determined from the given information. 

Test: ACT Earth Sciences Data Representation Questions - Question 9

In a specific region, a scientist recorded the rainfall, in inches, during the months of May, June, July and August. The scientist recorded this data in the same spot each month over four years. The purpose of this study was to see how the new factories built in the area impacted the rainfall in that location. 

What trend can be noticed in the data?

Detailed Solution for Test: ACT Earth Sciences Data Representation Questions - Question 9

Looking at the month with the most rainfall, one will notice in year 1 that July has the most rainfall with 3.8", in year 2 it is also July with 4.1" and so on. Therefore in any year of the given data the month with the most rain is always July. In year 1 the total rainfall for the months was 11.8", in year 2 it was 13.8", in year 3 it was 15.4" and in year 4 it was 18.5" indicating that the rainfall increases each year. 

Test: ACT Earth Sciences Data Representation Questions - Question 10

Explorers have discovered a new planet, Planet K. It is known that Planet K has magnetic poles to similar to those of Earth, so the explorers decide that using a compass to navigate is possible. When navigating Planet K's surface, it is discovered that the compass points north for a distance then flips so that it points north in the opposite direction for a distance, before returning to pointing north in the original direction. It is known that the magnetic poles of the planet flip every 100 years. Weather is recorded on the planet for 250 years. 

How does the flipping of the magnetic poles affect the weather on Planet K?

Detailed Solution for Test: ACT Earth Sciences Data Representation Questions - Question 10

It can be seen in the data table that in the years 0, 100 and 200 the temperature is well below zero and the precipitation is much less than that recorded in the years 50, 150 and 250. Since the poles flip direction every 100 years it is reasonable to assume that the flipping of the poles causes a decrease in temperature and a reduction in the precipitation. 

Information about Test: ACT Earth Sciences Data Representation Questions Page
In this test you can find the Exam questions for Test: ACT Earth Sciences Data Representation Questions solved & explained in the simplest way possible. Besides giving Questions and answers for Test: ACT Earth Sciences Data Representation Questions, EduRev gives you an ample number of Online tests for practice

Top Courses for ACT

Download as PDF

Top Courses for ACT