Class 3 Exam  >  Class 3 Tests  >  Test: Pictograph - Class 3 MCQ

Test: Pictograph - Class 3 MCQ


Test Description

15 Questions MCQ Test - Test: Pictograph

Test: Pictograph for Class 3 2025 is part of Class 3 preparation. The Test: Pictograph questions and answers have been prepared according to the Class 3 exam syllabus.The Test: Pictograph MCQs are made for Class 3 2025 Exam. Find important definitions, questions, notes, meanings, examples, exercises, MCQs and online tests for Test: Pictograph below.
Solutions of Test: Pictograph questions in English are available as part of our course for Class 3 & Test: Pictograph solutions in Hindi for Class 3 course. Download more important topics, notes, lectures and mock test series for Class 3 Exam by signing up for free. Attempt Test: Pictograph | 15 questions in 20 minutes | Mock test for Class 3 preparation | Free important questions MCQ to study for Class 3 Exam | Download free PDF with solutions
Test: Pictograph - Question 1

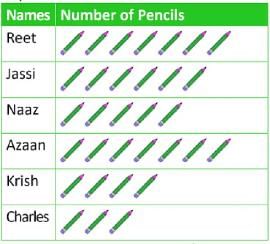
How many pencils do Azaan and Charles have in all?

Test: Pictograph - Question 2

DIRECTION: The given pictograph shows the number of 4 different kinds of plants Mohit bought. Study the pictograph and answer the questions.
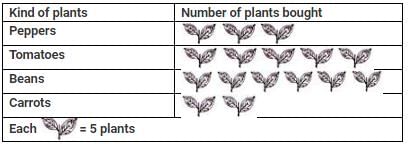
Q. What is the total number of plants he buy?

Detailed Solution for Test: Pictograph - Question 2

Number of pepper plants he bought = 3×5=15
Number of tomato plants he bought = 5×5=25
Number of bean plants he bought = 6×5=30
Number of carrot plants he bought = 2×5=10
∴Total number of plants Mohit bought = 15+25+30+10 =80

Test: Pictograph - Question 3

DIRECTION: The given pictograph shows the number of children who came to story hour each week. Study the pictograph and answer the following questions.
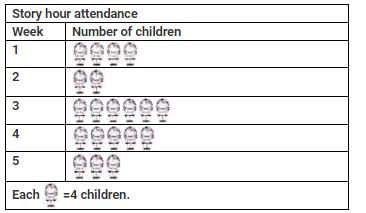
Q. How many children came to story hour in week 4?

Detailed Solution for Test: Pictograph - Question 3

Number of children came in week 4 = 5 × 4 = 20

Test: Pictograph - Question 4

DIRECTION: The given pictograph shows the number of children who came to story hour each week. Study the pictograph and answer the following questions.
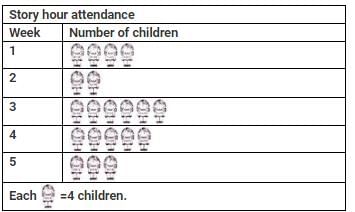
Q. How many more children came for story hour in week 3 than in week 2?

Detailed Solution for Test: Pictograph - Question 4

Number of children came in week 3 = 6 × 4 = 24
Number of children came in week 2 = 2 × 4 = 8
∴ Difference = 24 − 8 = 16 So, 16 more children came for story hour in week 3 than in week 2.

Test: Pictograph - Question 5

DIRECTION: The given pictograph shows the number of children who came to story hour each week. Study the pictograph and answer the following questions.
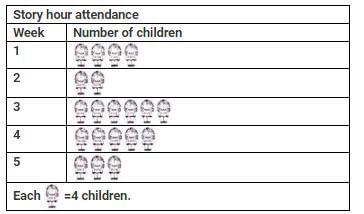
Q. Total number of children came for story hours in all weeks is _______.

Detailed Solution for Test: Pictograph - Question 5

Number of children came in week 1 = 4×4=16
Number of children came in week 2 = 2×4=8
Number of children came in week 3 = 6×4=24
Number of children came in week 4 =5×4=20
Number of children came in week 5 =3×4=12
∴Total number of children came for story hour in all weeks =16+8+24+20+12=80

Test: Pictograph - Question 6

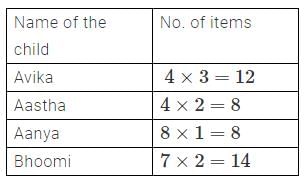
Study the given table and answer the question based on the data in the table.
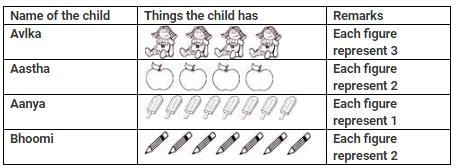
Q. Who had the maximum number of items?

Detailed Solution for Test: Pictograph - Question 6


∴ Bhoomi has the maximum number of items.  

Test: Pictograph - Question 7

The given pictograph graph shows the number of bookmarks each student made. Study the pictograph and answer the following question.
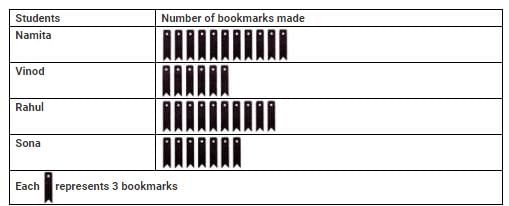
Q. How many less bookmarks did Namita make than Sona and Vinod together?

Detailed Solution for Test: Pictograph - Question 7

Number of bookmarks made by Sona =7×3=21
Number of bookmarks made by Vinod = 6×3=18
∴ Number of bookmarks made by Sona and Vinod together =21+18=39
Now, number of bookmarks made by Namita =11×3=33
∴ Required difference =39−33=6. So, Namita made 6 less bookmarks than Sona and Vinod together.

Test: Pictograph - Question 8

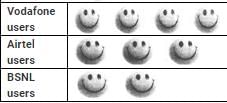
Direction: A survey was conducted on a group of 90 students. The information obtained is shown below: [Here 1  = 10 persons]

Q. The number of vodafone users is ______

Test: Pictograph - Question 9

Direction: A survey was conducted on a group of 90 students. The information obtained is shown below: [Here 1  = 10 persons]

Q. The number of Airtel users is _________

Test: Pictograph - Question 10

If each of the following balls is arranged in a group of 5 balls, how many such groups are possible? 

Test: Pictograph - Question 11

Direction: Read the table given below and answer the question accordingly:
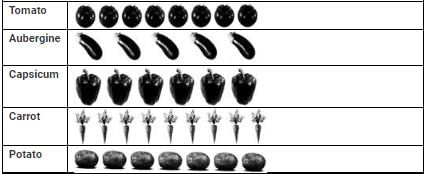
Q. How many capsicums are there?

Test: Pictograph - Question 12

Direction: Read the table given below and answer the question accordingly:
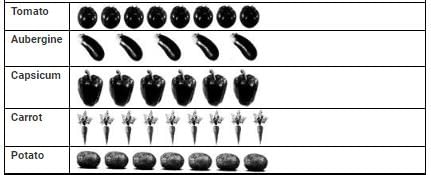
Q. Which kind of vegetable is minimum in number?

Test: Pictograph - Question 13

Direction: Read the table given below and answer the question accordingly:
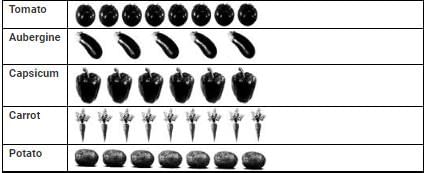
Q. What is the total number of vegetables?

Test: Pictograph - Question 14

Direction: Read the table given below and answer the question accordingly:
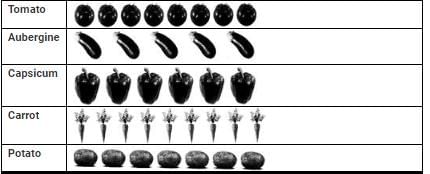
Q. Which kind of vegetable is maximum in number?

Test: Pictograph - Question 15

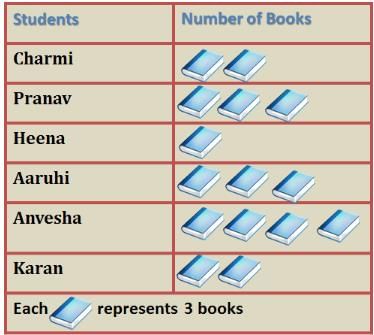
How many more books did Anvesha read than Heena?

Detailed Solution for Test: Pictograph - Question 15

Number of books read by each = number of picture of book x number of books represented by each picture

Number of books read by Heena =

1 x 3 = 3 books

Number of books read by Anvesha =

4 x 3 = 12 books 

Difference = 12 - 3 = 9 books

Information about Test: Pictograph Page
In this test you can find the Exam questions for Test: Pictograph solved & explained in the simplest way possible. Besides giving Questions and answers for Test: Pictograph, EduRev gives you an ample number of Online tests for practice
Download as PDF