Gaseous State MCQ - 2 (Advanced) - JEE MCQ
15 Questions MCQ Test - Gaseous State MCQ - 2 (Advanced)
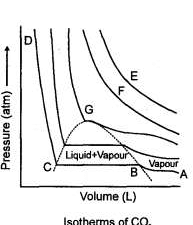
In the Figure, isotherms of CO2 at several temperatures near the critical point are shown. At the critical point (critical state), the distinction between the liquid and gaseous states disappear and the density of the gaseous substance is equal to that in the liquid state. For every gas this occurs at specific values of temperature and pressure, called critical temperature and critical pressure respectively. At temperatures and pressures above the critical point value, a gas is said be in a supercritical state. Critical constants are evaluated by solving the Vander W aals equation which is a cubic in volume. The values are Tc


In the supercritical region the behaviour is studied by plotting Z vs P plots. The variation in this region is studied with respect to boyles temperature a


At temperature
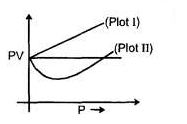
higher than CB the variation is linear (Plot I) and at temperature lower than CB the variation is non linear (Plot II) With reference to the passage answers the following questions:
Q.
Which statement(s) about the behaviour of a real gas is/are wrong?
higher than CB the variation is linear (Plot I) and at temperature lower than CB the variation is non linear (Plot II) With reference to the passage answers the following questions:
In the Figure, isotherms of CO2 at several temperatures near the critical point are shown. At the critical point (critical state), the distinction between the liquid and gaseous states disappear and the density of the gaseous substance is equal to that in the liquid state. For every gas this occurs at specific values of temperature and pressure, called critical temperature and critical pressure respectively. At temperatures and pressures above the critical point value, a gas is said be in a supercritical state. Critical constants are evaluated by solving the Vander W aals equation which is a cubic in volume. The values are Tc


In the supercritical region the behaviour is studied by plotting Z vs P plots. The variation in this region is studied with respect to boyles temperature a


At temperature
higher than CB the variation is linear (Plot I) and at temperature lower than CB the variation is non linear (Plot II) With reference to the passage answers the following questions:
Q.
The figure shows the effect of pressure on the compressibility factor, Z of a gas :The wrong conclusion(s) is/are:

higher than CB the variation is linear (Plot I) and at temperature lower than CB the variation is non linear (Plot II) With reference to the passage answers the following questions:
In the Figure, isotherms of CO2 at several temperatures near the critical point are shown. At the critical point (critical state), the distinction between the liquid and gaseous states disappear and the density of the gaseous substance is equal to that in the liquid state. For every gas this occurs at specific values of temperature and pressure, called critical temperature and critical pressure respectively. At temperatures and pressures above the critical point value, a gas is said be in a supercritical state. Critical constants are evaluated by solving the Vander W aals equation which is a cubic in volume. The values are Tc


In the supercritical region the behaviour is studied by plotting Z vs P plots. The variation in this region is studied with respect to boyles temperature a


At temperature
higher than CB the variation is linear (Plot I) and at temperature lower than CB the variation is non linear (Plot II) With reference to the passage answers the following questions:
Q.
Two vandaer waals gases have same value of 'a' but different value of b which of the following statement is correct.
higher than CB the variation is linear (Plot I) and at temperature lower than CB the variation is non linear (Plot II) With reference to the passage answers the following questions:
In the Figure, isotherms of CO2 at several temperatures near the critical point are shown. At the critical point (critical state), the distinction between the liquid and gaseous states disappear and the density of the gaseous substance is equal to that in the liquid state. For every gas this occurs at specific values of temperature and pressure, called critical temperature and critical pressure respectively. At temperatures and pressures above the critical point value, a gas is said be in a supercritical state. Critical constants are evaluated by solving the Vander W aals equation which is a cubic in volume. The values are Tc
In the supercritical region the behaviour is studied by plotting Z vs P plots. The variation in this region is studied with respect to boyles temperature a
At temperature
higher than CB the variation is linear (Plot I) and at temperature lower than CB the variation is non linear (Plot II) With reference to the passage answers the following questions:
Q.
Two Vander waals gases have same value 'b' but different 'a' value then which of the following statement is correct under similar condition.
In the Figure, isotherms of CO2 at several temperatures near the critical point are shown. At the critical point (critical state), the distinction between the liquid and gaseous states disappear and the density of the gaseous substance is equal to that in the liquid state. For every gas this occurs at specific values of temperature and pressure, called critical temperature and critical pressure respectively. At temperatures and pressures above the critical point value, a gas is said be in a supercritical state. Critical constants are evaluated by solving the Vander W aals equation which is a cubic in volume. The values are Tc
In the supercritical region the behaviour is studied by plotting Z vs P plots. The variation in this region is studied with respect to boyles temperature a
At temperature
higher than CB the variation is linear (Plot I) and at temperature lower than CB the variation is non linear (Plot II) With reference to the passage answers the following questions:
Q.
From the given plot between z and P for a real gas the correct is:
In the Figure, isotherms of CO2 at several temperatures near the critical point are shown. At the critical point (critical state), the distinction between the liquid and gaseous states disappear and the density of the gaseous substance is equal to that in the liquid state. For every gas this occurs at specific values of temperature and pressure, called critical temperature and critical pressure respectively. At temperatures and pressures above the critical point value, a gas is said be in a supercritical state. Critical constants are evaluated by solving the Vander W aals equation which is a cubic in volume. The values are Tc
In the supercritical region the behaviour is studied by plotting Z vs P plots. The variation in this region is studied with respect to boyles temperature a
At temperature
higher than CB the variation is linear (Plot I) and at temperature lower than CB the variation is non linear (Plot II) With reference to the passage answers the following questions:
Q.
A gas can be condensed to liquid through the paths I, II, and Ill, as shown in figure. The path(s) through which the gas changes to liquid abruptly is (are)
Sketch shows the plot of Z v/s P for of a hypothetical gas for one mole at three distinct temperature.
Boyle’s temperature is the temperature at which a gas shows ideal behaviour over a pressure range in the low pressure region. Boyle's temperature (Tb) = a/Rb . If a plot is obtained at temperatures well below Boyle's temperature then the curve will show negative deviation, in low pressure region and positive deviation in the high pressure region. Near critical temperature the curve is more likely as CO2 and the temperature well above critical temperature curve is more like H2 at 0°C as shown above. At high pressure suppose all the constant temperature curve varies linearly with pressure according to the following equation:
Q.
Which of the following is correct:
Sketch shows the plot of Z v/s P for of a hypothetical gas for one mole at three distinct temperature.
Boyle’s temperature is the temperature at which a gas shows ideal behaviour over a pressure range in the low pressure region. Boyle's temperature (Tb) = a/Rb . If a plot is obtained at temperatures well below Boyle's temperature then the curve will show negative deviation, in low pressure region and positive deviation in the high pressure region. Near critical temperature the curve is more likely as CO2 and the temperature well above critical temperature curve is more like H2 at 0°C as shown above. At high pressure suppose all the constant temperature curve varies linearly with pressure according to the following equation:
Q.
For 500 K plot value of Z changes from 2 to 2.2 if pressure is varied from 1000 atm to 1200 atm (high pressure) then the value of b/RTwill be
Sketch shows the plot of Z v/s P for of a hypothetical gas for one mole at three distinct temperature.
Boyle’s temperature is the temperature at which a gas shows ideal behaviour over a pressure range in the low pressure region. Boyle's temperature (Tb) = a/Rb . If a plot is obtained at temperatures well below Boyle's temperature then the curve will show negative deviation, in low pressure region and positive deviation in the high pressure region. Near critical temperature the curve is more likely as CO2 and the temperature well above critical temperature curve is more like H2 at 0°C as shown above. At high pressure suppose all the constant temperature curve varies linearly with pressure according to the following equation:
Q.
As shown in the figure at 200 K and 500 atm value of compressibility factor is 2 (approx). Then volume of the gas at this point will be
Sketch shows the plot of Z v/s P for of a hypothetical gas for one mole at three distinct temperature.
Boyle’s temperature is the temperature at which a gas shows ideal behaviour over a pressure range in the low pressure region. Boyle's temperature (Tb) = a/Rb . If a plot is obtained at temperatures well below Boyle's temperature then the curve will show negative deviation, in low pressure region and positive deviation in the high pressure region. Near critical temperature the curve is more likely as CO2 and the temperature well above critical temperature curve is more like H2 at 0°C as shown above. At high pressure suppose all the constant temperature curve varies linearly with pressure according to the following equation:
Q.
Plot at Boyle's temperature for the gas will be
In very high pressure region if Z v/s P is plotted at 1200 K for the above gas then it will have greatest slope.
For a fixed amount of the gas match the two column:
Column-I Column II


