Year 2 Exam  >  Year 2 Tests  >  Test: Statistics - Year 2 MCQ

Test: Statistics - Year 2 MCQ


Test Description

10 Questions MCQ Test - Test: Statistics

Test: Statistics for Year 2 2024 is part of Year 2 preparation. The Test: Statistics questions and answers have been prepared according to the Year 2 exam syllabus.The Test: Statistics MCQs are made for Year 2 2024 Exam. Find important definitions, questions, notes, meanings, examples, exercises, MCQs and online tests for Test: Statistics below.
Solutions of Test: Statistics questions in English are available as part of our course for Year 2 & Test: Statistics solutions in Hindi for Year 2 course. Download more important topics, notes, lectures and mock test series for Year 2 Exam by signing up for free. Attempt Test: Statistics | 10 questions in 20 minutes | Mock test for Year 2 preparation | Free important questions MCQ to study for Year 2 Exam | Download free PDF with solutions
Test: Statistics - Question 1

This graph shows favourite colours in a class. What was the least favourite colour?

Detailed Solution for Test: Statistics - Question 1

Yellow is the shortest bar and red was the most popular colour

Test: Statistics - Question 2

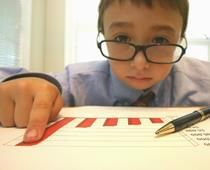
Sam is struggling to read his bar chart. He has labelled the numbers at the side, but what else should he have done?
Detailed Solution for Test: Statistics - Question 2

Labelling the information on a graph is really helpful for anyone trying to understand it

1 Crore+ students have signed up on EduRev. Have you? Download the App
Test: Statistics - Question 3

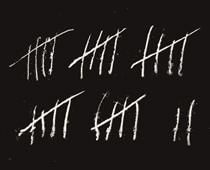
How much has been tallied here?

Detailed Solution for Test: Statistics - Question 3

Each group is a group of 5 when we tally

Test: Statistics - Question 4

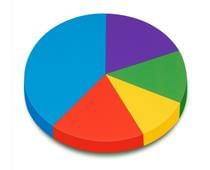
This pie chart shows the colours of swimming costumes in a class. What is the most popular colour?
Detailed Solution for Test: Statistics - Question 4

The largest section of the 'pie' is blue, so this is most popular

Test: Statistics - Question 5

Sam measured himself every month for a year and wrote his results in a table. What would you expect to see?

Detailed Solution for Test: Statistics - Question 5

Most children grow at least a few centimetres each year

Test: Statistics - Question 6

What kind of chart might you use to show the different eye colours in the class?
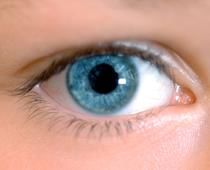
Detailed Solution for Test: Statistics - Question 6

A pictogram is a clear visual way of presenting information

Test: Statistics - Question 7

If 5 children have blue eyes, 3 children have green eyes, and 2 children have brown eyes, how many children have blue eyes altogether?

Detailed Solution for Test: Statistics - Question 7

To find out how many children have blue eyes, look at the tally chart or bar chart representing eye colors.

Test: Statistics - Question 8

In a class of 20 students, 8 have a dog, 5 have a cat, and 7 have a rabbit. Which pet is the most popular?

Detailed Solution for Test: Statistics - Question 8

The most popular pet is determined by the highest number of students who have that pet in the bar chart or table.

Test: Statistics - Question 9

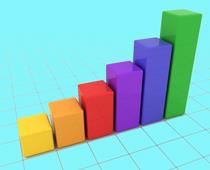
Which colour has the highest value in this bar chart?

Detailed Solution for Test: Statistics - Question 9

The green bar is the tallest so it must have the highest value

Test: Statistics - Question 10

If a pictogram shows 1 smiley face for every 2 apples collected by students, and there are 10 smiley faces, how many apples were collected?

Detailed Solution for Test: Statistics - Question 10

To find the number of apples collected, multiply the number of smiley faces by 2, as each smiley face represents 2 apples in the pictogram.

Information about Test: Statistics Page
In this test you can find the Exam questions for Test: Statistics solved & explained in the simplest way possible. Besides giving Questions and answers for Test: Statistics, EduRev gives you an ample number of Online tests for practice

Top Courses for Year 2

Download as PDF

Top Courses for Year 2