Test: Data Handling and Presentation - 2 - Class 6 MCQ
10 Questions MCQ Test - Test: Data Handling and Presentation - 2

What does the width of a bar in a bar graph represent?
Directions For Questions: The following pictograph shows the number of scooters sold by a company during a week. Study the pictograph carefully and answer the questions given below.
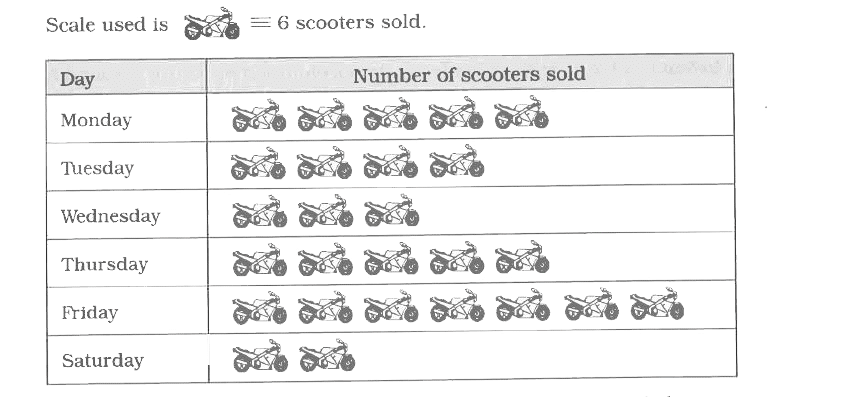
On which day of the week was the sale of the scooters was maximum?
On which day of the week was the sale of the scooters was maximum?

If you need to represent data on the number of pets owned by students in different grades, which type of graph is most suitable?
Representation of data in tabular form is done by using _______ .
In the data 18, 13, 15, 13, 18, 14, 15, 13, 14, 15, how many times the number '15' repeats itself?
Read the given bar graph and answer the question given below
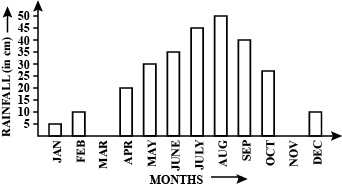
Which month maximum rainfall?
The frequency of 2 in the data 1, 1, 2, 2, 3, 3, 4, 4, 2, 2, 3, is ______ .
The given graph shows the marks scored by a student in his class test. Read the graph shown and answer the questions:

Highest marks are scored in ______ .
If  represents 5 eggs how many eggs does


 represent?
 represents 5 eggs, then


 represents 4 times 5 eggs.


 = 4 × 5 = 20 eggs.
The sale of electric bulbs on different days of a week is shown below:
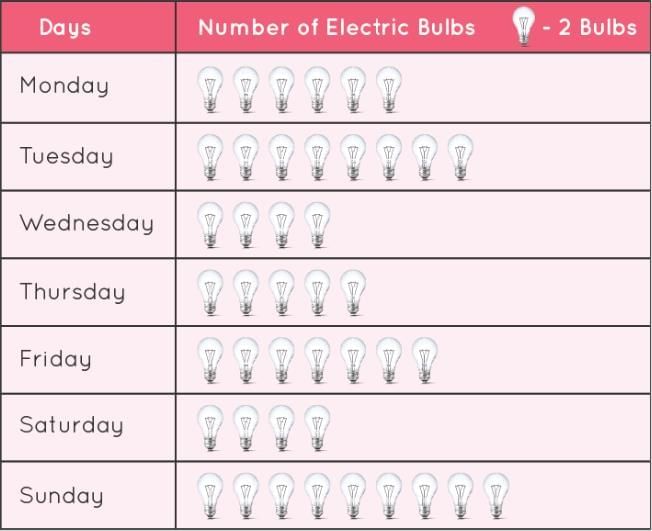
Q. How many bulbs were sold on Tuesday?


Important Questions for Data Handling and Presentation - 2
Data Handling and Presentation - 2 MCQs with Answers
Online Tests for Data Handling and Presentation - 2
|
© EduRev
|
Education Revolution
|


|


