Data Interpretation- 3 - Free MCQ Practice Test with solutions, CLAT Quant
MCQ Practice Test & Solutions: Test: Data Interpretation- 3 (20 Questions)
You can prepare effectively for CLAT Quantitative Techniques for CLAT with this dedicated MCQ Practice Test (available with solutions) on the important topic of "Test: Data Interpretation- 3". These 20 questions have been designed by the experts with the latest curriculum of CLAT 2026, to help you master the concept.
Test Highlights:
- - Format: Multiple Choice Questions (MCQ)
- - Duration: 30 minutes
- - Number of Questions: 20
Sign up on EduRev for free to attempt this test and track your preparation progress.

Study the following graph carefully and answer the following questions given below.
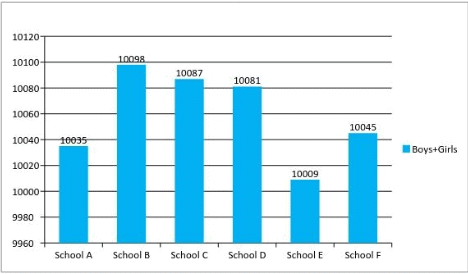
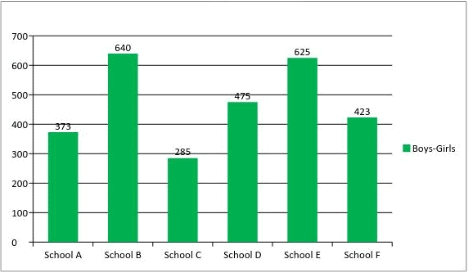
What is the difference between Number of Girls in School A and Number of Girls in School B?
Detailed Solution: Question 1
Study the following graph carefully and answer the following questions given below.
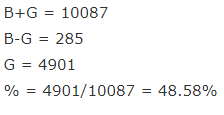
Girls in School C forms approximately what percent of the total number students in that School?
Detailed Solution: Question 2

Study the following graph carefully and answer the following questions given below.
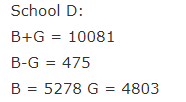
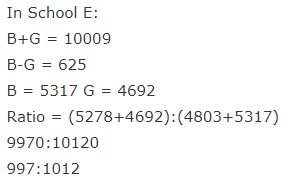
What is the ratio of Sum of Boys in School D and Girls in School E together to the Sum of Girls in School D and Boys in School E together is?
Detailed Solution: Question 3
Study the following graph carefully and answer the following questions given below.
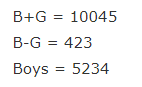
How many number of Boys are there in School F?
Detailed Solution: Question 4
Study the following graph carefully and answer the following questions given below.
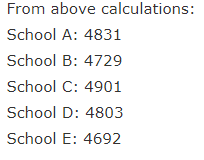
In which of the following School least no of Girls are present?
Detailed Solution: Question 5
Q(6-10) Study the Pie Chart and answer the following questions
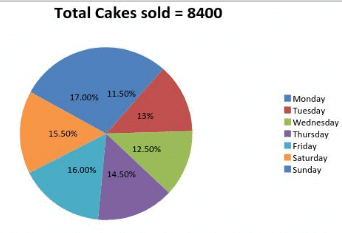
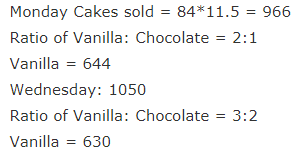
The ratio of Number of Vanilla Cakes Sold to Chocolate Cakes Sold is 2:1 of the total cakes sold on Monday and the ratio of the number of Vanilla Cakes Sold to Chocolate Cakes Sold is 3:2 in the total Cakes sold on Wednesday. Then difference of Vanilla Cakes Sold on Monday and Vanilla Cakes sold on Wednesday is?
Detailed Solution: Question 6
Q(6-10) Study the Pie Chart and answer the following questions
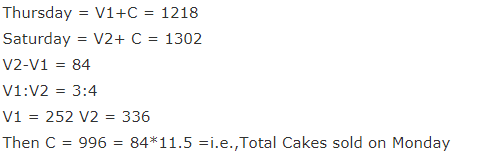
If the ratio of Vanilla Cakes Sold on Thursday to Vanilla Cakes sold on Saturday is 3:4, Number of Chocolate Cakes Sold on Thursday is equal to Number of Chocolate on Saturday then Number of Chocolate Cakes sold on Saturday is equal to total number of Cakes sold on which day?
Detailed Solution: Question 7
Q(6-10) Study the Pie Chart and answer the following questions
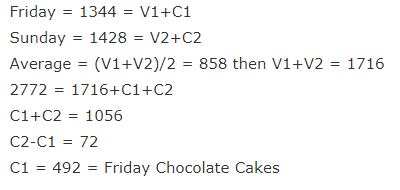
If the average number of Vanilla Cakes Sold on Friday and Sunday are 858 and Number of Chocolate Cakes Sold on Sunday are 72 more than Number of Chocolate Cakes sold on Friday then Number of Chocolate Cakes sold on Friday is?
Detailed Solution: Question 8
Q(6-10) Study the Pie Chart and answer the following questions
Ratio of Vanilla Cakes Sold to Chocolate Cakes Sold is 46:45 on Tuesday then how many number of Vanilla Cakes are Sold on that day?
Detailed Solution: Question 9
Q(6-10) Study the Pie Chart and answer the following questions
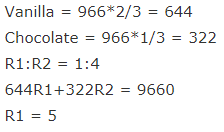
If the ratio of Vanilla Cakes sold to Chocolate Cakes sold on Monday is 2:1 and the ratio of Selling Price of Vanilla Cake to Chocolate Cake is the 1:4, total amount earned by him on Monday is Rs.9660 then what is the rate of One Vanilla Cake?
Detailed Solution: Question 10
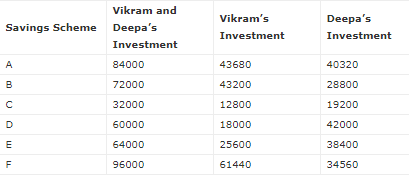
Study the following graph carefully and answer the following questions given below.
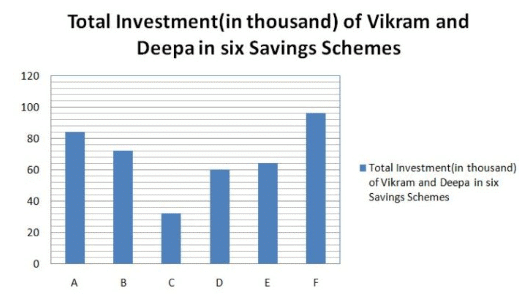
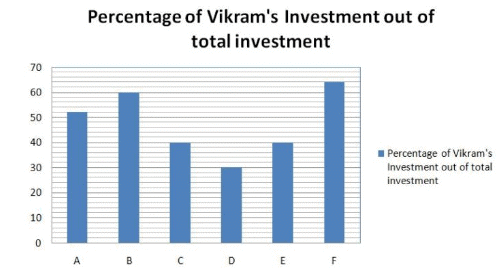
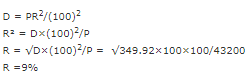
The Amount invested by Vikram in savings scheme G is equal to the amount invested by him in savings scheme B. The rate of interest (p.c.p.a.) of savings scheme G and B are the same. The only difference is that savings scheme G offers compound interest (compounded annually)whereas the savings scheme B offers simple interest. If the difference between the interest earned by Vikram from both the schemes after 2 years is Rs. 349.92, what is the rate of interest?
Detailed Solution: Question 11
Study the following graph carefully and answer the following questions given below.
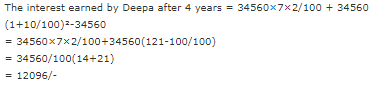
Deepa invested in savings scheme F for 4 years. If the savings scheme F offers simple interest at the rate of 7 p.c.p.a. for the first two years and then compound interest at the rate of 10 p.c.p.a. (compounded annually) for the third and fourth year, what will be the interest earned by Deepa after 4 years?
A. 12,364
A. 12,364
Detailed Solution: Question 12
Study the following graph carefully and answer the following questions given below.
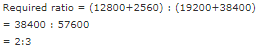
What is the respective ratio between the total amount invested by Vikram in scheme C and E together and the total amount invested by Deepa in the same savings scheme together?
Detailed Solution: Question 13
Study the following graph carefully and answer the following questions given below.
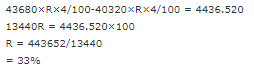
Savings Scheme A offers simple interest at a certain rate of interest (p.c.p.a.). If the difference between the interests earned by Vikram and Deepa from Savings Scheme A after 4 years is Rs.4435.50, what is the rate of interest (p.c.p.a)?
Detailed Solution: Question 14
Study the following graph carefully and answer the following questions given below.
What is the average amount invested by Vikram in savings schemes A,B,C,D and E together?
Detailed Solution: Question 15

Study the following graph carefully and answer the following questions given below.
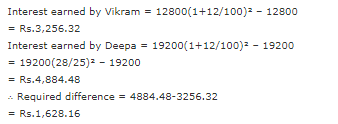
If Scheme C offers compound interest (compounded annually) at the rate of 12 p.c.p.a., what is the difference between interests earned by Vikram and Deepa from scheme C after 2 years?
Detailed Solution: Question 16
Study the following graph carefully and answer the following questions given below.
If the savings scheme D offers compound interest (compounded half yearly) at the rate of 16 p.c.p.a, what would be sum of interests earned by Vikram and Deepa from savings scheme D after one year?
Detailed Solution: Question 17
Study the following graph carefully and answer the following questions given below.
Total investment in Savings Schemes A and F by Vikram is what percent of the total investment in the same Savings Schemes by Deepa?
Detailed Solution: Question 18
Study the following graph carefully and answer the following questions given below.
What is the sum of the average amount invested in Savings schemes A, D and E by Vikram and the average amount invested in Savings schemes B, C and F by Deepa?
Detailed Solution: Question 19
Study the following graph carefully and answer the following questions given below.
What is the difference between the average amount invested in Savings schemes A, B, D and E by Vikram and the average amount invested in Savings schemes B, C, E and F by Deepa?
Detailed Solution: Question 20
49 videos|188 docs|73 tests |