Test: Data Interpretation- 3 - Railways MCQ
20 Questions MCQ Test - Test: Data Interpretation- 3

Study the following graph carefully to answer the given questions
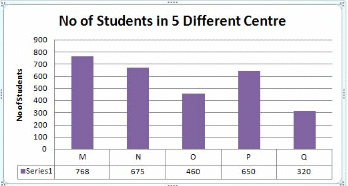
If the ratio of number of boys & girls are in the ratio 3:2 in N and P, find the average number of boys in N and P together ?
Study the following graph carefully to answer the given questions
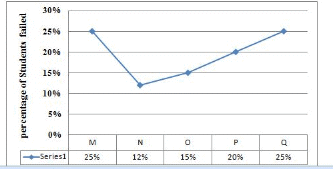
Find the total no of failed students in M, O and Q together ?

Study the following graph carefully to answer the given questions
What will be the ratio of number of boys passed in N to number of girls failed in N, if the number of girls and boys in the ratio 16:11 ?
Study the following graph carefully to answer the given questions
Find the difference between the number of passed students in Q to number of failed students in M ?
Study the following graph carefully to answer the given questions
Which centre has the second least number of failed student ?
Study the following table carefully to answer the given questions
Classification of 50 Students based on the marks obtained by them in Quants & Reasoning in Prelim exam
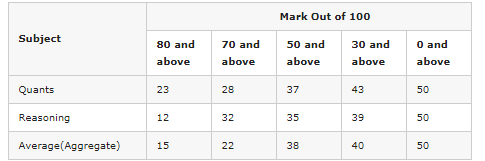
The number of students scoring less than 30% marks in aggregate is?
Study the following table carefully to answer the given questions
Classification of 50 Students based on the marks obtained by them in Quants & Reasoning in Prelim exam
If it is known that at least 20 students were eligible for main exam, then the minimum qualifying marks in Reasoning for eligibility to attend the main exam(Top 20 students only can attend main exam )?
Study the following table carefully to answer the given questions
Classification of 50 Students based on the marks obtained by them in Quants & Reasoning in Prelim exam
The percentage of number of students scored 70% marks in Quants is what percentage of number of students scored 30% marks in aggregate ?
Study the following table carefully to answer the given questions
Classification of 50 Students based on the marks obtained by them in Quants & Reasoning in Prelim exam
If at least 50% marks in aggregate are required for interview, how many students will be eligible to attend interview?
Study the following table carefully to answer the given questions
Classification of 50 Students based on the marks obtained by them in Quants & Reasoning in Prelim exam
What is the different between the number of students passed with 80 as cut-off marks in Quants and 30 as cut-off marks in aggregate together to no of students passed with 70 as cut-off marks in aggregate and 50 as cut off in Reasoning?
(Q.no: 11-15). Refer to the following Line Graph and answer the given questions.
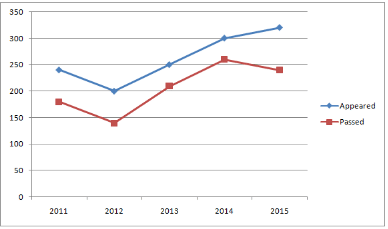
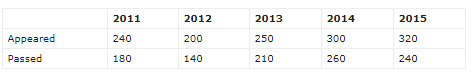
The number of students who could pass the exam in the year 2016 were 10% more than that in the previous year. Only 75% of those who appeared in the year 2016 could pass the exam that year. How many students appeared for the exam in the year 2016?
(Q.no: 11-15). Refer to the following Line Graph and answer the given questions.
Number of students who had passed the exam in the year 2012 are what percent less than that in the year 2013?
(Q.no: 11-15). Refer to the following Line Graph and answer the given questions.
What percent of students who appeared for the exam in the year 2011 could pass the exam?
(Q.no: 11-15). Refer to the following Line Graph and answer the given questions.
What is the respective ratio of total number of students who appeared for the exam in the years 2014 and 2015 together and the total number of students who could pass the exam in the same years together?
(Q.no: 11-15). Refer to the following Line Graph and answer the given questions.
What is the average number of students who passed for the exam in all the years together?
(Q.no: 16-20). Refer to the following table and answer the given questions.
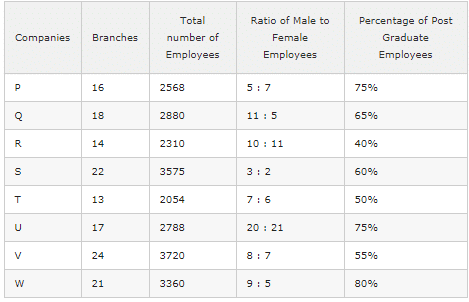
If the number of male post graduate employees in company W is 1488, what percent of the female employees in that particular company are post graduate?
(Q.no: 16-20). Refer to the following table and answer the given questions.
In which of the given companies is the percentage of women employees with respect to the total number of employees(both males and females) in that company the third lowest?
(Q.no: 16-20). Refer to the following table and answer the given questions.
What is the ratio of the total number of male employees in companies Q and W together to the total number of female employees in Companies R and S together?
(Q.no: 16-20). Refer to the following table and answer the given questions.
What is the sum of the average number of post graduate employees in companies P, Q and S together and the average number of post graduate employees in companies U, V and W?
(Q.no: 16-20). Refer to the following table and answer the given questions.
Which of the given companies has the second highest number of average employees per office?
Important Questions for Data Interpretation- 3
Data Interpretation- 3 MCQs with Answers
Online Tests for Data Interpretation- 3
|
© EduRev
|
Education Revolution
|


|


