


All Exams >
UGC NET >
3 Months Preparation for UGC NET Paper 1 >
All Questions
All questions of Histograms for UGC NET Exam
The following histogram shows the marks scored by 40 to student in a test of 30 marks. A student has to score a minimum of 10 marksto pass the test.
 Q. What is the percentage of students who scored 20 or more marks? (correct to one decimal place)
 - a)15%
- b)57.5%
- c)55%
- d)37.5%
Correct answer is option 'D'. Can you explain this answer?
The following histogram shows the marks scored by 40 to student in a test of 30 marks. A student has to score a minimum of 10 marksto pass the test.
Q. What is the percentage of students who scored 20 or more marks? (correct to one decimal place)
a)
15%
b)
57.5%
c)
55%
d)
37.5%
|
|
Academia Elite answered |
Given:
Total number of students = 40
Total number of students = 40
Calculation:
The total number of students who scored 20 or more marks = 10 + 5 = 15
The percentage = (15/40) × 100 = 37.5%
∴ The total 37.5% of students scored 20 or more marks.
The total number of students who scored 20 or more marks = 10 + 5 = 15
The percentage = (15/40) × 100 = 37.5%
∴ The total 37.5% of students scored 20 or more marks.

A histogram is to be drawn for following frequency distribution
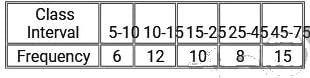 Q. The adjusted frequency for classinterval 15-25 will be :
- a)2
- b)5
- c)3
- d)None of the above
Correct answer is option 'B'. Can you explain this answer?
A histogram is to be drawn for following frequency distribution
Q. The adjusted frequency for classinterval 15-25 will be :
a)
2
b)
5
c)
3
d)
None of the above

|
JKL Classes answered |
Formula Used:
Adjusted frequency = (Frequency of the classinterval x Minimum ClassWidth)/Class width of the required interval
Adjusted frequency = (Frequency of the classinterval x Minimum ClassWidth)/Class width of the required interval
Calculation:
For classinterval
15 - 25,
Classwidth = upper limit of the class- lower limit of the class
=> Classwidth = 2 5 - 1 5 = 1 0
Frequency of that interval = 10
Minimum classwidth here is for the interval 5 - 10= 5
Adjusted frequency = (10* 5)/10= 5
Therefore, the adjusted frequency for the class interval 15 - 25 is 5.
Study the following graph and answerthe question given below.
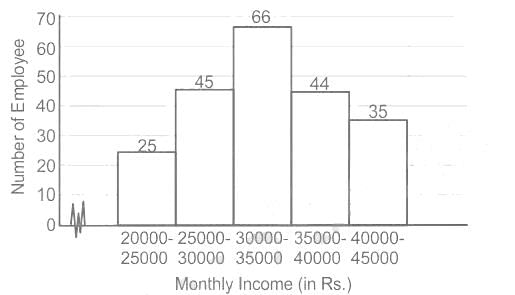 Q. What percentage (approx.) of the employees working in the range of Rs. 30,000 - Rs. 40,000?
- a)51%
- b)49%
- c)55%
- d) None of the above
Correct answer is option 'A'. Can you explain this answer?
Study the following graph and answerthe question given below.
Q. What percentage (approx.) of the employees working in the range of Rs. 30,000 - Rs. 40,000?
a)
51%
b)
49%
c)
55%
d)
None of the above

|
Riverdale Learning Institute answered |
Given:
The number of employees whose income is in the range of Rs. 20,000 - Rs. 25,000 = 25
The number of employees whose income is in the range of Rs. 25,000 - Rs. 30,000 = 45
The number of employees whose income is in the range of Rs. 30,000 - Rs. 35,000 = 66
The number of employees whose income is in the range of Rs. 35,000 - Rs. 40,000 = 44
number of employees whose income is in the range of Rs. 40,000 - Rs. 45,000 = 35
Calculation:
According to the question, The total number of employee = 25 + 45 + 66 + 44 + 35 = 215
The number of employees whose income is in the range of Rs. 30,000-Rs. 40,000 = 66 + 44 = 110
The required percentage = 110 x 100 ≈ 51%
According to the question, The total number of employee = 25 + 45 + 66 + 44 + 35 = 215
The number of employees whose income is in the range of Rs. 30,000-Rs. 40,000 = 66 + 44 = 110
The required percentage = 110 x 100 ≈ 51%
Study the given histogram and answer the question that follows.
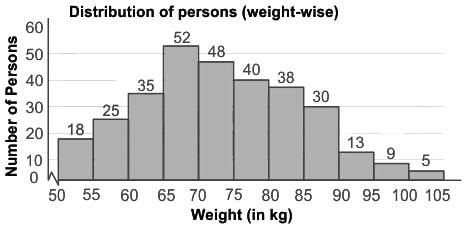
Q. The number of persons weighing 55 kg or more but less than 75 kg is what percentage more than the number of persons weighing 80 kg or more but less than 100 kg (correct to one decimal place)?- a)88.2%
- b)77.8%
- c)68.4%
- d)66.7%
Correct answer is option 'B'. Can you explain this answer?
Study the given histogram and answer the question that follows.
Q. The number of persons weighing 55 kg or more but less than 75 kg is what percentage more than the number of persons weighing 80 kg or more but less than 100 kg (correct to one decimal place)?
Q. The number of persons weighing 55 kg or more but less than 75 kg is what percentage more than the number of persons weighing 80 kg or more but less than 100 kg (correct to one decimal place)?
a)
88.2%
b)
77.8%
c)
68.4%
d)
66.7%
|
|
Riverdale Learning Institute answered |
Calculation:
The number of persons weighing 55 kg or more but less than 75 kg = (25 + 35 + 52 + 48) = 160
The number of persons weighing 80 kg or more but less than 100 kg = (38 + 30 + 13 + 9) = 90
Now,
Required percentage = [(160 – 90)/90 × 100]
⇒ (70/90 × 100)
⇒ (700/9)
⇒ 77.8%
∴ The required percentage is 77.8%
The given histogram represents the marks of students in Mathematics test of a certain class. The total number of students is 350.
Study the graph and answer the question that follows.
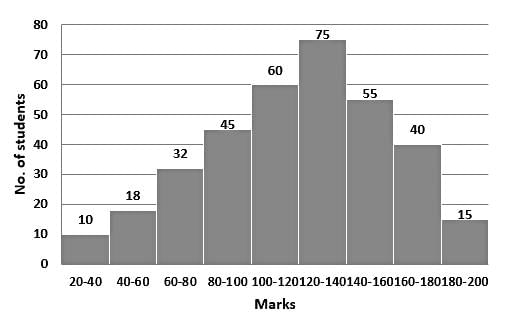 Q. What is the ratio of the total number of students who scored 140 marks and above to the total number of students who scored marks between 60 to 120?
- a)11 : 9
- b)9 : 11
- c)110 : 137
- d)137 : 110
Correct answer is option 'C'. Can you explain this answer?
The given histogram represents the marks of students in Mathematics test of a certain class. The total number of students is 350.
Study the graph and answer the question that follows.
Study the graph and answer the question that follows.
Q. What is the ratio of the total number of students who scored 140 marks and above to the total number of students who scored marks between 60 to 120?
a)
11 : 9
b)
9 : 11
c)
110 : 137
d)
137 : 110
|
|
Academia Elite answered |
Given:
The total number of students = 350
The total number of students = 350
Calculation:
The total number of students who scored 140 marks and above = 55 + 40 + 15 = 110
The total number of students who scored marks between 60 to 120 = 32 + 45 + 60 = 137
The ratio = 110 : 137
∴ The ratio of the total number of students who scored 140 marks and above to the total number of students who scored marks between 60 to 120 is 110 : 137
The given histogram showsthe daily wages (in Rs.)of workers in a factory. Study the histogram and answerthe question that follows.
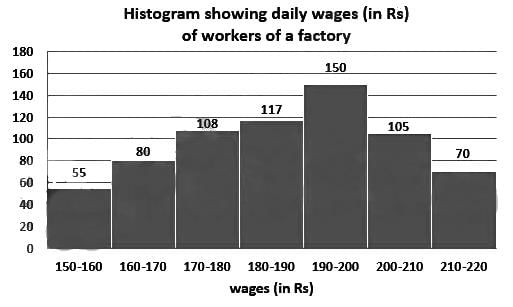 Q. The number of workers with daily wages lessthan Rs. 180 is what percentage of the number of workers with daily wages more than Rs. 190? Expressyour answer correct to one decimal place.
- a)75.8%
- b)85.6%
- c)74.8%
- d)86.7%
Correct answer is option 'C'. Can you explain this answer?
The given histogram showsthe daily wages (in Rs.)of workers in a factory. Study the histogram and answerthe question that follows.
Q. The number of workers with daily wages lessthan Rs. 180 is what percentage of the number of workers with daily wages more than Rs. 190? Expressyour answer correct to one decimal place.
a)
75.8%
b)
85.6%
c)
74.8%
d)
86.7%
|
|
Riverdale Learning Institute answered |
Given:
There is the histogram shows the daily wages ( in Rs.)of workers in a factory.
Calculation:
The number of workers with daily wages lessthan Rs.180= 55+ 80+ 108 = 243
The number of workers with daily wages is more than Rs. 190 = 150+ 105+ 70 = 325
The percentage = (243/325) x 100 = 74.76...% = 74.8%
∴ The number of workers with daily wages less than Rs. 180 is 74.8% of the number of workers with daily wages more than Rs. 190
Study the histogram and answer the question given below.
The graph represents the number of students obtaining a percentage of marks in class X Board examination in 2018 in a school.
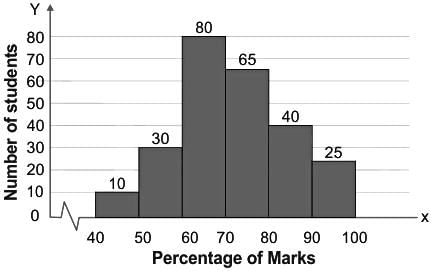 Q. The number of students who have secured less than 60% marks is what per cent lessthan the number of students who have secured 80% marks and above?
- a)33.5%
- b)37.4%
- c)29.7%
- d)None of the above
Correct answer is option 'D'. Can you explain this answer?
Study the histogram and answer the question given below.
The graph represents the number of students obtaining a percentage of marks in class X Board examination in 2018 in a school.
The graph represents the number of students obtaining a percentage of marks in class X Board examination in 2018 in a school.
Q. The number of students who have secured less than 60% marks is what per cent lessthan the number of students who have secured 80% marks and above?
a)
33.5%
b)
37.4%
c)
29.7%
d)
None of the above
|
|
Riverdale Learning Institute answered |
Calculation:
Total students who have secured less than 60% = 10 + 30
⇒ 40
Total students who have secured 80 or more than 80% = 40 + 25
⇒ 65
Difference = 65 - 40
⇒ 25
Required % = (25/65) × 100
⇒ 38.46 ≈ 38.5%
∴ Required answer is 38.5%.
Total students who have secured less than 60% = 10 + 30
⇒ 40
Total students who have secured 80 or more than 80% = 40 + 25
⇒ 65
Difference = 65 - 40
⇒ 25
Required % = (25/65) × 100
⇒ 38.46 ≈ 38.5%
∴ Required answer is 38.5%.
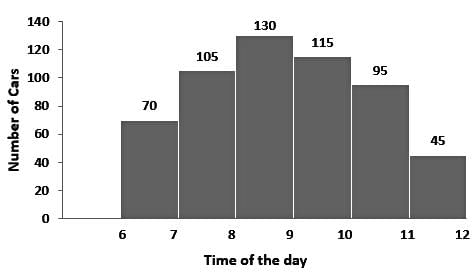
The number of cars passing the road near a colony from 6 am to 12 noon has been shown in the following histogram.
What is the ratio of the number of cars passed between 6 am and 8 am to the number of cars passed between 9 am and 11 am?
- a)7 : 4
- b)21 : 19
- c)14 : 23
- d)5 : 6
Correct answer is option 'D'. Can you explain this answer?
The number of cars passing the road near a colony from 6 am to 12 noon has been shown in the following histogram.
What is the ratio of the number of cars passed between 6 am and 8 am to the number of cars passed between 9 am and 11 am?
What is the ratio of the number of cars passed between 6 am and 8 am to the number of cars passed between 9 am and 11 am?
a)
7 : 4
b)
21 : 19
c)
14 : 23
d)
5 : 6
|
|
Riverdale Learning Institute answered |
Given:
There are the number of cars passing the road near a colony from 6 am to 12 noon has been shown in the following histogram.
There are the number of cars passing the road near a colony from 6 am to 12 noon has been shown in the following histogram.
Calculation:
The number of cars passed between 6 am and 8 am = 70 + 105 = 175
The number of cars passed between 9 am and 11 am = 115 + 95 = 210
The ratio = 175 : 210 = 5 : 6
∴ The ratio of the number of cars passed between 6 am and 8 am to the number of cars passed between 9 am and 11 am is 5 : 6
The number of cars passed between 6 am and 8 am = 70 + 105 = 175
The number of cars passed between 9 am and 11 am = 115 + 95 = 210
The ratio = 175 : 210 = 5 : 6
∴ The ratio of the number of cars passed between 6 am and 8 am to the number of cars passed between 9 am and 11 am is 5 : 6
The following histogram shows the marks scored by 40 to student in a test of 30 marks. A student has to score a minimum of 10 marksto pass the test.
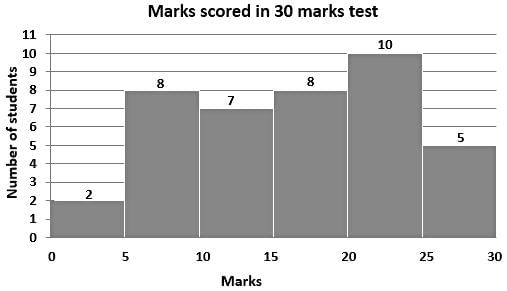 Q. How many students have passedthe test and obtained lessthan 50% marks?
- a)15
- b)7
- c)10
- d)17
Correct answer is option 'B'. Can you explain this answer?
The following histogram shows the marks scored by 40 to student in a test of 30 marks. A student has to score a minimum of 10 marksto pass the test.
Q. How many students have passedthe test and obtained lessthan 50% marks?
a)
15
b)
7
c)
10
d)
17
|
|
JKL Classes answered |
Given:
The total marks of the test = 30
Minimum pass marks = 10
The total marks of the test = 30
Minimum pass marks = 10
Calculation:
50% of the total marks = (50/100) × 30 = 15
Total number of students who scored between 10 and 15 = 7
∴ A total number of 7 students have passed the test and obtained less than 50% marks.
50% of the total marks = (50/100) × 30 = 15
Total number of students who scored between 10 and 15 = 7
∴ A total number of 7 students have passed the test and obtained less than 50% marks.
Observe the graph and answerthe question that follows.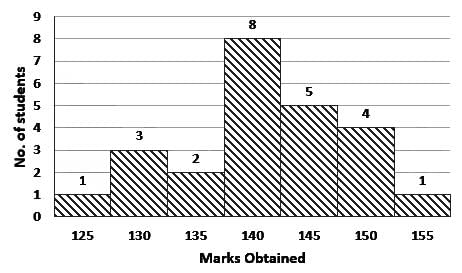 Q. How many students obtained marks more than 130?
- a)14
- b)19
- c)20
- d)17
Correct answer is option 'C'. Can you explain this answer?
Observe the graph and answerthe question that follows.
Q. How many students obtained marks more than 130?
a)
14
b)
19
c)
20
d)
17
|
|
JKL Classes answered |
Calculations:
According to the question,
Students obtained 135 marks = 2
Students obtained 140 marks = 8
Students obtained 145 marks = 5
Students obtained 150 marks = 4
Students obtained 155 marks = 1
Total students obtained marks more than 130 = 2 + 8 + 5 + 4 + 1 = 20
∴ 20 students obtained marks more than 130.
According to the question,
Students obtained 135 marks = 2
Students obtained 140 marks = 8
Students obtained 145 marks = 5
Students obtained 150 marks = 4
Students obtained 155 marks = 1
Total students obtained marks more than 130 = 2 + 8 + 5 + 4 + 1 = 20
∴ 20 students obtained marks more than 130.
Chapter doubts & questions for Histograms - 3 Months Preparation for UGC NET Paper 1 2025 is part of UGC NET exam preparation. The chapters have been prepared according to the UGC NET exam syllabus. The Chapter doubts & questions, notes, tests & MCQs are made for UGC NET 2025 Exam. Find important definitions, questions, notes, meanings, examples, exercises, MCQs and online tests here.
Chapter doubts & questions of Histograms - 3 Months Preparation for UGC NET Paper 1 in English & Hindi are available as part of UGC NET exam.
Download more important topics, notes, lectures and mock test series for UGC NET Exam by signing up for free.
3 Months Preparation for UGC NET Paper 1
231 videos|447 docs|128 tests
|
|
© EduRev
|
Education Revolution
|


|


Signup to see your scores
go up within 7 days!
Access 1000+ FREE Docs, Videos and Tests
Takes less than 10 seconds to signup