


All Exams >
CA Foundation >
Quantitative Aptitude for CA Foundation >
All Questions
All questions of Chapter 17: Correlation And Regression for CA Foundation Exam
The correlation between the speed of an automobile and the distance travelled by it after applying the brakes is- a)Negative
- b)Zero
- c)Positive
- d)None of these
Correct answer is option 'C'. Can you explain this answer?
The correlation between the speed of an automobile and the distance travelled by it after applying the brakes is
a)
Negative
b)
Zero
c)
Positive
d)
None of these
|
|
Rajat Patel answered |
The stopping distance is proportional to the square of the Speed of the car ( before applying brakes)
That is.. If you double your speed…the distance required to stop your car becomes four times.
Similarly,
If the vehicle doesn't come to halt but slowes down…
The stopping distance is proportional to the difference in the squares of the initial speed and the final speed

If the covariance between two variables is 20 and the variance of one of the variables is 16, what would be the variance of the other variable?- a)More than 100
- b)More than 10
- c)Less than 10
- d)More than 1.25
Correct answer is option 'A'. Can you explain this answer?
If the covariance between two variables is 20 and the variance of one of the variables is 16, what would be the variance of the other variable?
a)
More than 100
b)
More than 10
c)
Less than 10
d)
More than 1.25
|
|
Abhilash Choudhury answered |
Given, Cov (x, y) =20
and variance of one of the variables is 16.
so the standard deviation SD is 4.
we know the formula,
r= cov (x, y) /(SD of x * SD of Y)
r= 20 /4 * SD of the other variable
r= 5/ SD of the other variable
we also know that coefficient of correlation, r, lies between -1 and +1 including them.
so, SD of the other variable has to be atleast 5 or more.
so the variance will be 5^2 = 25 atleast or more.
i dont know why the icai book says the answer is more than 100. if anybody can match the answer with book then please tell me.
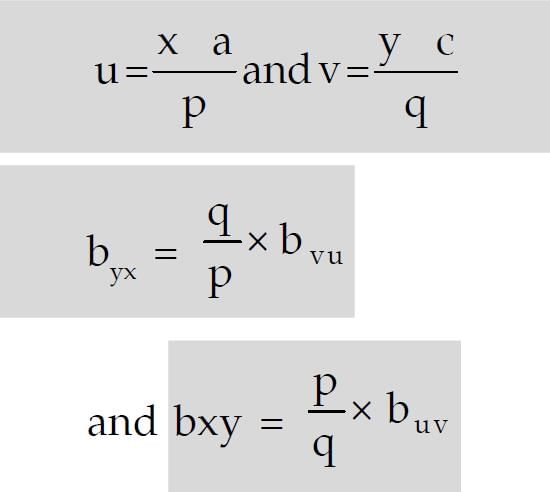
If u = 2x + 5 and v = –3y – 6 and regression coefficient of y on x is 2.4, what is the regression coefficient of v on u?- a)3.6
- b)–3.6
- c)2.4
- d)–2.4
Correct answer is option 'B'. Can you explain this answer?
If u = 2x + 5 and v = –3y – 6 and regression coefficient of y on x is 2.4, what is the regression coefficient of v on u?
a)
3.6
b)
–3.6
c)
2.4
d)
–2.4

|
Ankita Mukherjee answered |
Regression coefficient of y on x
- The regression coefficient of y on x is given by the formula:
bxy = (covariance of x and y) / (variance of x)
- We are given that the regression coefficient of y on x is 2.4.
bxy = 2.4
Expressing u and v in terms of x and y
- We are given that:
u = 2x + 5
v = 3y - 6
- We can express x and y in terms of u and v:
x = (u - 5) / 2
y = (v + 6) / 3
Regression coefficient of v on u
- We want to find the regression coefficient of v on u.
- We can use the formula for the regression coefficient of y on x, but with u and v switched:
bvu = (covariance of u and v) / (variance of u)
- We can express the covariance of u and v in terms of the covariance of x and y:
covariance of u and v = covariance of (2x + 5) and (3y - 6)
= 6 * covariance of x and y
- We can express the variance of u in terms of the variance of x:
variance of u = variance of (2x + 5)
= 4 * variance of x
- Substituting these expressions into the formula for bvu:
bvu = (6 * covariance of x and y) / (4 * variance of x)
= (3/2) * (covariance of x and y) / (variance of x)
= (3/2) * bxy
= 3.6
Answer: (B) 3.6
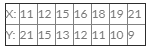
The following data relate to the heights of 10 pairs of fathers and sons:(175, 173), (172, 172), (167, 171), (168, 171), (172, 173), (171, 170), (174, 173), (176, 175) (169, 170), (170, 173) Q. The regression equation of height of son on that of father is given by- a)y = 100 + 5x
- b)y = 99.708 + 0.405x
- c)y = 89.653 + 0.582x
- d)y = 88.758 + 0.562x
Correct answer is option 'B'. Can you explain this answer?
The following data relate to the heights of 10 pairs of fathers and sons:
(175, 173), (172, 172), (167, 171), (168, 171), (172, 173), (171, 170), (174, 173), (176, 175) (169, 170), (170, 173)
Q. The regression equation of height of son on that of father is given by
a)
y = 100 + 5x
b)
y = 99.708 + 0.405x
c)
y = 89.653 + 0.582x
d)
y = 88.758 + 0.562x

|
Hrishikesh Pillai answered |
Regression Analysis:
Regression analysis is a statistical method to determine the relationship between two or more variables. It is used to find the relationship between a dependent variable (y) and one or more independent variables (x1, x2, …, xn).
In this question, we need to find the regression equation of the height of the son on that of the father.
Data Given:
The following data relate to the heights of 10 pairs of fathers and sons:
(175, 173), (172, 172), (167, 171), (168, 171), (172, 173), (171, 170), (174, 173), (176, 175), (169, 170), (170, 173)
Calculations:
- Calculate the mean of the heights of fathers (x̄) and the mean of the heights of sons (ȳ).
- Calculate the deviations of the heights of fathers (xi) and the heights of sons (yi) from their respective means.
- Calculate the sum of the products of the deviations of the heights of fathers and sons.
- Calculate the sum of the squares of the deviations of the heights of fathers.
- Calculate the slope (b) of the regression equation using the formula:
b = Σ(xi * yi) / Σ(xi^2)
- Calculate the intercept (a) of the regression equation using the formula:
a = ȳ - b * x̄
- The regression equation of the height of son on that of father is given by:
y = a + bx
where y is the height of the son and x is the height of the father.
Solution:
- Mean of the heights of fathers (x̄) = (175 + 172 + 167 + 168 + 172 + 171 + 174 + 176 + 169 + 170) / 10 = 171.4
- Mean of the heights of sons (ȳ) = (173 + 172 + 171 + 171 + 173 + 170 + 173 + 175 + 170 + 173) / 10 = 172.1
- Deviations of the heights of fathers (xi) = (175 - 171.4), (172 - 171.4), (167 - 171.4), (168 - 171.4), (172 - 171.4), (171 - 171.4), (174 - 171.4), (176 - 171.4), (169 - 171.4), (170 - 171.4) = 3.6, 0.6, -4.4, -3.4, 0.6, -0.4, 2.6, 4.6, -2.4, -1.4
- Deviations of the heights of sons (yi) = (173 - 172.1), (172 - 172.1), (171 - 172.1), (171 - 172.1), (173 - 172.1), (170 - 172.1), (173 - 172.1), (175 - 172.1), (170 - 172.1), (173 - 172.1) = 0.9, -0.1, -1.1, -1.1,
Variance may be positive, negative or zero.- a)true
- b)false
- c)both
- d)none
Correct answer is option 'B'. Can you explain this answer?
Variance may be positive, negative or zero.
a)
true
b)
false
c)
both
d)
none

|
Pallabi Deshpande answered |
Variance measures how far a data set is spread out. The technical definition is “The average of the squared differences from the mean” but all it really does is to give you a very general idea of the spread of your data. A value of zero means that there is no variability; All the numbers in the data set are the same.
Variance cannot be negative: The reason is that the way variance is calculated makes a negative result mathematically impossible.
Variance is the average squared deviation from the mean.
(Direction 1-40) Write the correct answers. Each question carries 1 mark.Q. Bivariate Data are the data collected for- a)Two variables
- b)More than two variables
- c)Two variables at the same point of time
- d)Two variables at different points of time.
Correct answer is option 'C'. Can you explain this answer?
(Direction 1-40) Write the correct answers. Each question carries 1 mark.
Q. Bivariate Data are the data collected for
a)
Two variables
b)
More than two variables
c)
Two variables at the same point of time
d)
Two variables at different points of time.

|
Ishani Rane answered |
Bivariate data deals with two variables that can change and are compared to find relationships. If one variable is influencing another variable, then you will have bivariate data that has an independent and a dependent variable. This is because one variable depends on the other for change.
Researchers often use bivariate and multivariate analysis to examine the relationship among multiple variables at the same time.
The correlation between the speed of an automobile and the distance travelled by it after applying the brakes is- a)Negative
- b)Zero
- c)Positive
- d)None of these.
Correct answer is option 'A'. Can you explain this answer?
The correlation between the speed of an automobile and the distance travelled by it after applying the brakes is
a)
Negative
b)
Zero
c)
Positive
d)
None of these.
|
|
Poonam Reddy answered |
ANSWER :- a
Solution :- Initially the acceleration will be negative then finally the speed and distance will become 0.
Age of Applicants for life insurance and the premium of insurance – correlations are
- a)Positive
- b)Negative
- c)Zero
- d)None
Correct answer is option 'A'. Can you explain this answer?
Age of Applicants for life insurance and the premium of insurance – correlations are
a)
Positive
b)
Negative
c)
Zero
d)
None
|
|
Divya Dasgupta answered |
However, in general, the age of the applicant is a significant factor in determining the premium of life insurance. Younger individuals typically pay lower premiums since they are considered to be at lower risk of death than older individuals. As individuals age, their health risks increase, and therefore, the premium for life insurance also increases. Additionally, the type of life insurance policy, such as term or whole life insurance, and the amount of coverage also impact the premium.
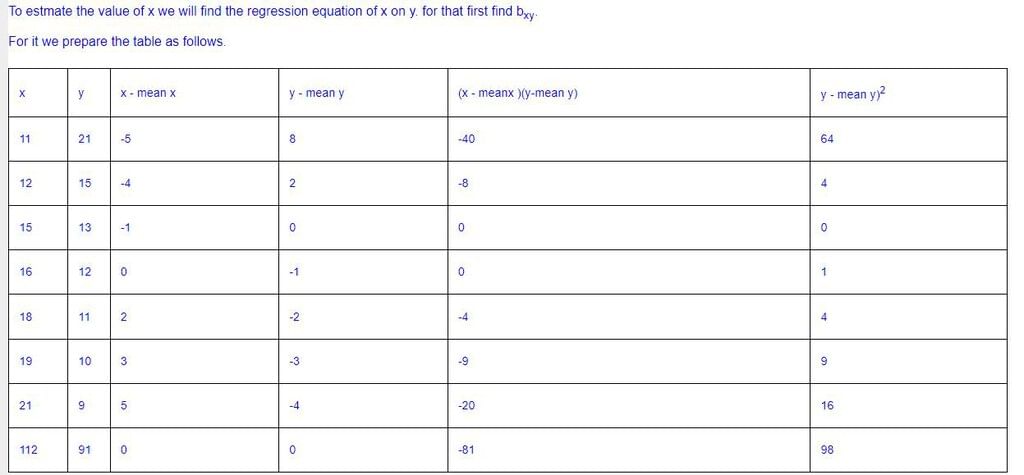
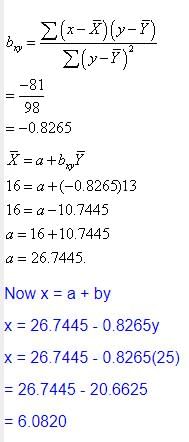
Given the following equations: 2x – 3y = 10 and 3x + 4y = 15, which one is the regression equation of x on y ?- a)1st equation
- b)2nd equation
- c)both the equations
- d)none of these
Correct answer is option 'D'. Can you explain this answer?
Given the following equations: 2x – 3y = 10 and 3x + 4y = 15, which one is the regression equation of x on y ?
a)
1st equation
b)
2nd equation
c)
both the equations
d)
none of these
|
|
Maheshwar Goyal answered |
I'm sorry, but you did not provide enough information or complete equations. Please provide the complete equations and state what you want me to do with them.
The regression coefficients remain unchanged due to a- a)Shift of origin
- b)Shift of scale
- c)Both (a) and (b)
- d)(a) or (b)
Correct answer is option 'A'. Can you explain this answer?
The regression coefficients remain unchanged due to a
a)
Shift of origin
b)
Shift of scale
c)
Both (a) and (b)
d)
(a) or (b)

|
Sameer Rane answered |
The regression coefficients remain unchanged due to a shift of origin but change due to a shift of scale. This property states that if the original pair of variables is (x, y) and if they are changed to the pair (u, v) where
(ii) The two lines of regression intersect at the point
(mea of "x", mean of "y"),
where x and y are the variables under consideration.
(iii) The coefficient of correlation between two variables x and y in the simple geometric mean of the two regression coefficients. The sign of the correlation coefficient would be the common sign of the two regression coefficients.
If y = 3x + 4 is the regression line of y on x and the arithmetic mean of x is –1, what is the arithmetic mean of y?- a)1
- b)–1
- c)7
- d)none of these
Correct answer is option 'A'. Can you explain this answer?
If y = 3x + 4 is the regression line of y on x and the arithmetic mean of x is –1, what is the arithmetic mean of y?
a)
1
b)
–1
c)
7
d)
none of these
|
|
Puja Singh answered |
Given:
- Regression line of y on x is y = 3x - 4
- Arithmetic mean of x is 1
To find:
- Arithmetic mean of y
Solution:
We know that the regression line of y on x is given by:
y = a + bx,
where a is the y-intercept and b is the slope of the line.
Comparing this with the given equation y = 3x - 4, we see that:
a = -4
b = 3
Now, we know that the arithmetic mean of x is given by:
x̄ = (x1 + x2 + ... + xn) / n,
where x1, x2, ..., xn are the n observations of x.
Since the arithmetic mean of x is 1, we have:
1 = (x1 + x2 + ... + xn) / n.
Multiplying both sides by n, we get:
x1 + x2 + ... + xn = n.
But we don't need to calculate n explicitly, since we only need to find the arithmetic mean of y.
The arithmetic mean of y is given by:
ȳ = (y1 + y2 + ... + yn) / n,
where y1, y2, ..., yn are the corresponding observations of y.
Substituting y = 3x - 4 in this expression, we get:
ȳ = (3x1 - 4) + (3x2 - 4) + ... + (3xn - 4) / n
= 3(x1 + x2 + ... + xn) / n - 4
= 3n / n - 4
= 3 - 4
= -1.
Therefore, the arithmetic mean of y is -1.
Answer: Option A (1) is incorrect. The correct answer is option D (none of these).
Given the regression equations as 3x + y = 13 and 2x + 5y = 20, which one is the regression equation of y on x?- a)1st equation
- b)2nd equation
- c)both (a) and (b)
- d)none of these
Correct answer is option 'B'. Can you explain this answer?
Given the regression equations as 3x + y = 13 and 2x + 5y = 20, which one is the regression equation of y on x?
a)
1st equation
b)
2nd equation
c)
both (a) and (b)
d)
none of these
|
|
Rajveer Yadav answered |
Regression Equations
The regression equation is an equation that represents the relationship between two variables. It is used to predict the value of one variable based on the value of another variable.
Given regression equations as 3x y = 13 and 2x 5y = 20, we need to find out which one is the regression equation of y on x.
Regression Equation of Y on X
The regression equation of y on x is an equation that represents the relationship between y and x. It is used to predict the value of y based on the value of x.
To find out which one is the regression equation of y on x, we need to put the equations in slope-intercept form y = mx + b, where m is the slope and b is the y-intercept.
Putting the first equation in slope-intercept form, we get:
3x + y = 13
y = -3x + 13
Putting the second equation in slope-intercept form, we get:
2x + 5y = 20
5y = -2x + 20
y = (-2/5)x + 4
Comparing the two equations, we can see that the second equation is the regression equation of y on x, because:
- It is in the form y = mx + b, where m is the slope and b is the y-intercept.
- The coefficient of x (-2/5) represents the slope of the line, which tells us how much y changes for each unit change in x.
- The y-intercept (4) represents the value of y when x is 0.
Therefore, the correct answer is option B, the second equation is the regression equation of y on x.
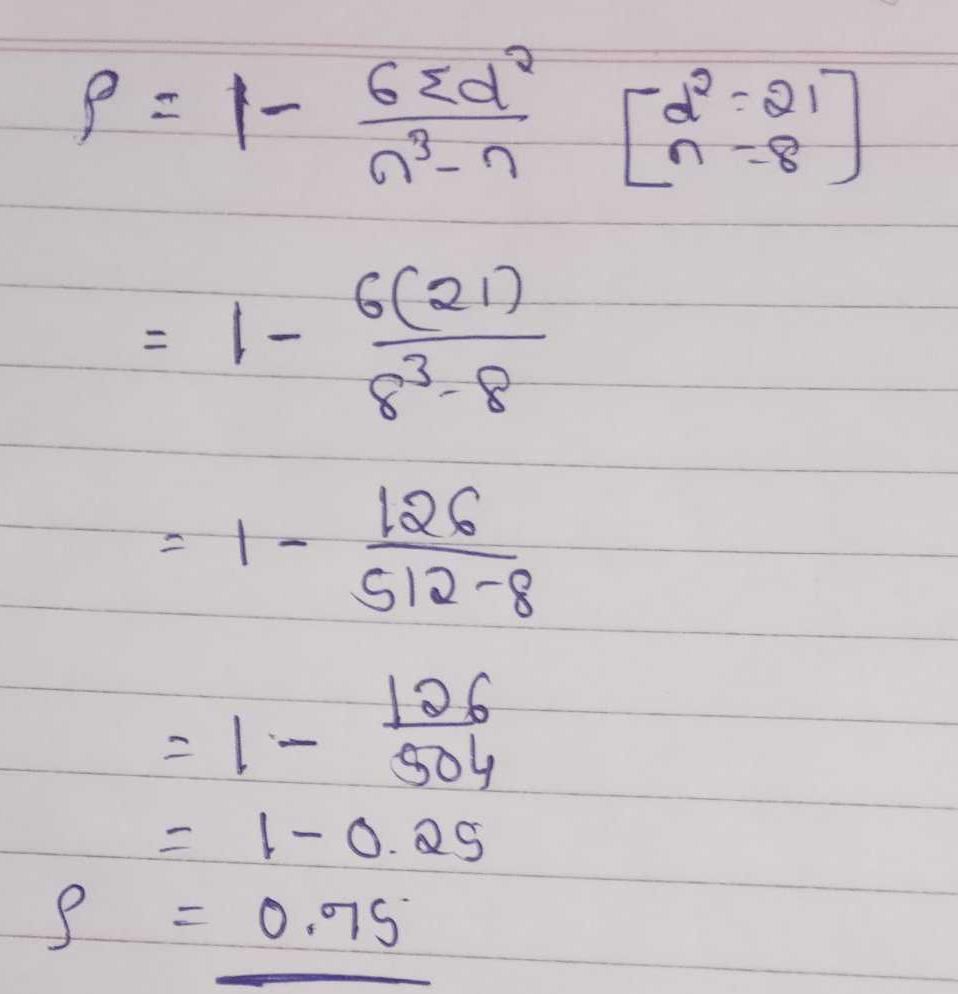
If the rank correlation coefficient between marks in management and mathematics for a group of student in 0.6 and the sum of squares of the differences in ranks in 66, what is the number of students in the group?- a)10
- b)9
- c)8
- d)11
Correct answer is option 'A'. Can you explain this answer?
If the rank correlation coefficient between marks in management and mathematics for a group of student in 0.6 and the sum of squares of the differences in ranks in 66, what is the number of students in the group?
a)
10
b)
9
c)
8
d)
11
|
|
Jatin Mehta answered |
Given:
- Rank correlation coefficient = 0.6
- Sum of squares of differences in ranks = 66
To find:
- Number of students in the group
Solution:
Let there be 'n' students in the group.
Finding the value of n:
- The sum of the first 'n' natural numbers is n(n+1)/2.
- Therefore, the sum of the ranks of the students in management and mathematics combined is n(n+1).
- Since each student has a rank in both subjects, the sum of their ranks should be counted twice, so we need to divide by 2.
- Therefore, the sum of the ranks in each subject is n(n+1)/2.
Finding the value of the rank correlation coefficient:
- The formula for rank correlation coefficient is given as:
r = 1 - (6∑d^2)/(n(n^2-1))
where,
d = difference in ranks
n = number of pairs of observations
- Here, the sum of squares of differences in ranks is given as 66.
- So, 6∑d^2 = 6(66) = 396.
Substituting the given values in the formula for r, we get:
0.6 = 1 - (396)/(n(n^2-1))
Simplifying this expression, we get:
0.6n^3 - 0.6n - 396.4 = 0
Using trial and error method, we can find that n=10 satisfies the above equation.
Therefore, the number of students in the group is 10.
Answer: Option (a) 10.
If the coefficient of correlation between two variables is 0.7 then the percentage of variation unaccounted for is- a)70%
- b)30%
- c)51%
- d)49%
Correct answer is option 'C'. Can you explain this answer?
If the coefficient of correlation between two variables is 0.7 then the percentage of variation unaccounted for is
a)
70%
b)
30%
c)
51%
d)
49%

|
Nouman Shabbir answered |
Square of 0.7 is 0.49 (49%)
100%-49% = 51%
100%-49% = 51%
For a bivariate frequency table having (p + q) classification the total number of cells is- a)p
- b)p + q
- c)q
- d)pq
Correct answer is option 'D'. Can you explain this answer?
For a bivariate frequency table having (p + q) classification the total number of cells is
a)
p
b)
p + q
c)
q
d)
pq
|
|
Raghavendra Choudhury answered |
Explanation:
A bivariate frequency table shows the frequency distribution of two variables. It consists of rows and columns where each cell represents the frequency count of a particular combination of the two variables.
Total number of cells in a bivariate frequency table is equal to the product of the number of categories or levels in each variable.
Therefore, for a (p q) classification, the total number of cells would be p x q, which is given by option D.
Hence, the correct answer is D.
HTML format:
Explanation:
- A bivariate frequency table shows the frequency distribution of two variables.
- It consists of rows and columns where each cell represents the frequency count of a particular combination of the two variables.
- Total number of cells in a bivariate frequency table is equal to the product of the number of categories or levels in each variable.
- Therefore, for a (p q) classification, the total number of cells would be p x q, which is given by option D.
- Hence, the correct answer is D.
If the plotted points in a scatter diagram are evenly distributed, then the correlation is
- a)Zero
- b)Negative
- c)Positive
- d)(a) or (b).
Correct answer is option 'A'. Can you explain this answer?
If the plotted points in a scatter diagram are evenly distributed, then the correlation is
a)
Zero
b)
Negative
c)
Positive
d)
(a) or (b).

|
Freedom Institute answered |
When points in a scatter diagram are evenly distributed in a random pattern, it means that there is no discernible trend or relationship between the two variables being plotted. This lack of a pattern indicates that as one variable changes, the other does not change in any predictable way.
In terms of correlation:
- Positive correlation: The points would trend upward from left to right, indicating that as one variable increases, the other also increases.
- Negative correlation: The points would trend downward from left to right, indicating that as one variable increases, the other decreases.
- Zero correlation: The points are scattered randomly without any clear upward or downward trend, showing no relationship between the variables.
Therefore, when the points are evenly distributed in a scatter diagram without any discernible pattern, the correlation is zero, meaning there's no linear relationship between the variables.
What are the limits of the correlation coefficient?- a)No limit
- b)–1 and 1
- c)0 and 1, including the limits
- d)–1 and 1, including the limits
Correct answer is option 'D'. Can you explain this answer?
What are the limits of the correlation coefficient?
a)
No limit
b)
–1 and 1
c)
0 and 1, including the limits
d)
–1 and 1, including the limits
|
|
Sameer Basu answered |
The limits of the correlation coefficient are between -1 and 1.
In case ‘Age and income’ correlation is- a)positive
- b)negative
- c)zero
- d)none
Correct answer is option 'A'. Can you explain this answer?
In case ‘Age and income’ correlation is
a)
positive
b)
negative
c)
zero
d)
none

|
Forem answered |
Since as age increases , income increases
therefore, the slope moves from left to right
therefore , positive correlation
therefore, the slope moves from left to right
therefore , positive correlation
What is the quickest method to find correlation between two variables?- a)Scatter diagram
- b)Method of concurrent deviation
- c)Method of rank correlation
- d)Method of product moment correlation
Correct answer is option 'B'. Can you explain this answer?
What is the quickest method to find correlation between two variables?
a)
Scatter diagram
b)
Method of concurrent deviation
c)
Method of rank correlation
d)
Method of product moment correlation
|
|
Sounak Jain answered |
Method of Concurrent Deviation
The quickest method to find correlation between two variables is the method of concurrent deviation. This method involves finding the deviation of each value of one variable from its mean and the deviation of each value of the other variable from its mean. The product of these deviations is then calculated for each pair of values and the sum of these products is divided by the product of the standard deviations of the two variables.
Steps involved in the Method of Concurrent Deviation:
1. Calculate the mean of both variables.
2. Calculate the deviation of each value of one variable from its mean.
3. Calculate the deviation of each value of the other variable from its mean.
4. Multiply the deviations of each pair of values.
5. Add up all the products obtained in step 4.
6. Divide the result obtained in step 5 by the product of the standard deviations of the two variables.
Formula for the Method of Concurrent Deviation:
r = (∑xy) / (√∑x² × √∑y²)
where,
r = correlation coefficient
x = deviation of x from its mean
y = deviation of y from its mean
Advantages of the Method of Concurrent Deviation:
1. It is a quick and easy method to calculate correlation.
2. It is useful when the data is in a small set.
3. It does not require the calculation of ranks or the construction of a scatter diagram.
Disadvantages of the Method of Concurrent Deviation:
1. It is less accurate than other methods of correlation.
2. It cannot be used when the data is in a large set.
3. It assumes that the relationship between the two variables is linear.
For the regression equation of Y on X , 2x + 3Y + 50 = 0. The value of bYX is- a)2/3
- b)– 2/3
- c)–3/2
- d)none
Correct answer is option 'B'. Can you explain this answer?
For the regression equation of Y on X , 2x + 3Y + 50 = 0. The value of bYX is
a)
2/3
b)
– 2/3
c)
–3/2
d)
none
|
|
Hrishikesh Pillai answered |
Regression Equation:
The regression equation of Y on X is given by:
2X + 3Y + 50 = 0
Solving for Y, we get:
3Y = -2X - 50
Y = (-2/3)X - (50/3)
Therefore, the slope of the regression line is -2/3.
Definition of bYX:
The slope of the regression line of Y on X is denoted by bYX. It represents the change in Y for a unit change in X.
Formula:
bYX = ∑(Xi - X̄)(Yi - Ȳ) / ∑(Xi - X̄)²
where Xi and Yi are the values of X and Y respectively, X̄ and Ȳ are their means.
Calculation of bYX:
Since the regression equation of Y on X is:
Y = (-2/3)X - (50/3)
Therefore, the value of bYX is -2/3.
Hence, the correct option is B.
What are the limits of the coefficient of concurrent deviations?- a)No limit
- b)Between –1 and 0, including the limiting values
- c)Between 0 and 1, including the limiting values
- d)Between –1 and 1, the limiting values inclusive
Correct answer is option 'D'. Can you explain this answer?
What are the limits of the coefficient of concurrent deviations?
a)
No limit
b)
Between –1 and 0, including the limiting values
c)
Between 0 and 1, including the limiting values
d)
Between –1 and 1, the limiting values inclusive
|
|
Sameer Rane answered |
Coefficient of concurrent deviations :
A very simple and casual method of finding correlation when we are not serious about the magnitude of the two variables is the application of concurrent deviations.
This method involves in attaching a positive sign for a x-value (except the first) if this value is more than the previous value and assigning a negative value if this value is less than the previous value.
This is done for the y-series as well. The deviation in the x-value and the corresponding y-value is known to be concurrent if both the deviations have the same sign.
Denoting the number of concurrent deviation by c and total number of deviations as m (which must be one less than the number of pairs of x and y values), the coefficient of concurrent-deviations is given by
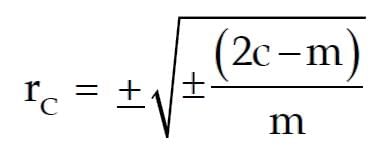
If (2c–m) > 0, then we take the positive sign both inside and outside the radical sign and if (2c–m) < 0, we are to consider the negative sign both inside and outside the radical sign.
Like Pearson’s correlation coefficient and Spearman’s rank correlation coefficient, the coefficient of concurrent- deviations also lies between –1 and 1, both inclusive.


In Method of Concurrent Deviations, only the directions of change (Positive direction / Negative direction) in the variables are taken into account for calculation of- a)coefficient of S.D
- b)coefficient of regression.
- c)coefficient of correlation
- d)none
Correct answer is option 'C'. Can you explain this answer?
In Method of Concurrent Deviations, only the directions of change (Positive direction / Negative direction) in the variables are taken into account for calculation of
a)
coefficient of S.D
b)
coefficient of regression.
c)
coefficient of correlation
d)
none
|
|
Rajveer Yadav answered |
Explanation:
Method of Concurrent Deviations is a statistical method used for the calculation of correlation coefficient between two variables. This method takes into account only the directions of change (Positive direction / Negative direction) in the variables for the calculation of coefficient of correlation.
Coefficient of correlation measures the degree of association or relationship between two variables. The value of coefficient of correlation ranges from -1 to +1. A value of -1 indicates a perfect negative correlation, 0 indicates no correlation, and +1 indicates a perfect positive correlation.
In Method of Concurrent Deviations, the calculation of coefficient of correlation involves the following steps:
1. Calculate the deviations of each variable from their respective means.
2. Determine the direction of change (Positive direction / Negative direction) for each deviation.
3. Multiply the deviations of the two variables that have the same direction of change.
4. Add up the products obtained in step 3.
5. Divide the sum obtained in step 4 by the product of the standard deviations of the two variables.
The coefficient of correlation obtained using Method of Concurrent Deviations is known as the Coefficient of Concurrent Deviation or Coefficient of Correlation by Signs.
Conclusion:
In conclusion, the Method of Concurrent Deviations is a statistical method used for the calculation of correlation coefficient between two variables. This method takes into account only the directions of change (Positive direction / Negative direction) in the variables for the calculation of coefficient of correlation. The coefficient of correlation obtained using Method of Concurrent Deviations is known as the Coefficient of Concurrent Deviation or Coefficient of Correlation by Signs.
If all the plotted points in a scatter diagram lie on a single line, then the correlation is- a)Perfect positive
- b)Perfect negative
- c)Both (a) and (b)
- d)Either (a) or (b).
Correct answer is option 'D'. Can you explain this answer?
If all the plotted points in a scatter diagram lie on a single line, then the correlation is
a)
Perfect positive
b)
Perfect negative
c)
Both (a) and (b)
d)
Either (a) or (b).

|
Prashanth Datta answered |
Scatter Diagram and Correlation
A scatter diagram is a graphical representation of the relationship between two variables. It shows the values of the variables as points in a two-dimensional space, with one variable on the x-axis and the other variable on the y-axis.
Correlation is a statistical measure of the strength and direction of the relationship between two variables. It ranges from -1 to +1, with values closer to -1 or +1 indicating a stronger relationship and values closer to 0 indicating a weaker relationship.
Single Line Scatter Diagram
If all the plotted points in a scatter diagram lie on a single line, then the correlation can be either perfect positive or perfect negative. This is because a perfect positive correlation indicates that the two variables increase or decrease together in a linear fashion, while a perfect negative correlation indicates that the two variables move in opposite directions in a linear fashion.
However, it is also possible for a scatter diagram with a single line to have a correlation that is not perfect. This can occur if there is some variation in the relationship between the two variables, even though the overall pattern is linear. In this case, the correlation will be a value between -1 and +1, but it will not be perfect.
Conclusion
In conclusion, if all the plotted points in a scatter diagram lie on a single line, then the correlation can be either perfect positive or perfect negative, but it is also possible for the correlation to be a value between -1 and +1 if there is some variation in the relationship between the two variables. Therefore, the correct answer to the given question is option D, either (a) or (b).
If the regression coefficient of y on x, the coefficient of correlation between x and y and variance of y are –3/4, –  and 4 respectively, what is the variance of x?
- a)2/
- b)16/3
- c)4/3
- d)4
Correct answer is option 'B'. Can you explain this answer?
If the regression coefficient of y on x, the coefficient of correlation between x and y and variance of y are –3/4, – and 4 respectively, what is the variance of x?
and 4 respectively, what is the variance of x?a)
2/
b)
16/3
c)
4/3
d)
4

|
Tanujasri M answered |
Given :- byx = -3/4. r= √3/2 V(y) = 4. V(x) = ?
S(y) = 2
byx = r × S(y)÷S(x)
-3/4 = √3/2 × 2÷S(x)
S(x) = -4√3÷3
S(x)= -4 ÷ √3
V(x) = [S(x)]^2 = 16÷3
S(y) = 2
byx = r × S(y)÷S(x)
-3/4 = √3/2 × 2÷S(x)
S(x) = -4√3÷3
S(x)= -4 ÷ √3
V(x) = [S(x)]^2 = 16÷3
If the relationship between two variables x and y in given by 2x + 3y + 4 = 0, then the value of the correlation coefficient between x and y is- a)0
- b)1
- c)– 1
- d)negative
Correct answer is option 'C'. Can you explain this answer?
If the relationship between two variables x and y in given by 2x + 3y + 4 = 0, then the value of the correlation coefficient between x and y is
a)
0
b)
1
c)
– 1
d)
negative

|
Arya Roy answered |
y = -2/3 x - 4/3 .. (1) which is regression equation of y on x and
x = -3/2 y -2 ...(2) which is regression of x on y. From (1), regression coefficient of y on x i.e. b (yx) = -2/3 & from (2) regression coefficient of x on y i.e. b (xy) = -3/2
We know, b(yx) * b (xy) = r^2 where r is the correlation coefficient of x & y. Hence r^2 = 1 Or, r = +/ - 1
In case the correlation coefficient between two variables is 1, the relationship between the two variables would be- a)y = a + bx
- b)y = a + bx, b > 0
- c)y = a + bx, b < 0
- d)y = a + bx, both a and b being positive
Correct answer is option 'B'. Can you explain this answer?
In case the correlation coefficient between two variables is 1, the relationship between the two variables would be
a)
y = a + bx
b)
y = a + bx, b > 0
c)
y = a + bx, b < 0
d)
y = a + bx, both a and b being positive
|
|
Rajveer Yadav answered |
Explanation:
The correlation coefficient measures the strength and direction of the linear relationship between two variables. It ranges from -1 to +1, where -1 indicates a perfectly negative linear relationship, 0 indicates no linear relationship, and +1 indicates a perfectly positive linear relationship.
When the correlation coefficient between two variables is 1, it means that there is a perfect positive linear relationship between the two variables. This implies that the two variables move in the same direction and that for every increase in one variable, there is a corresponding increase in the other variable.
In this case, the equation of the relationship between the two variables would be y = a + bx, where b > 0. This means that the value of y increases as the value of x increases, and that the line representing the relationship between the two variables is upward sloping.
Answer:
Therefore, option B is the correct answer, which states that the relationship between the two variables would be y = a + bx, where b > 0.
For a p x q bivariate frequency table, the maximum number of marginal distributions is- a)p
- b)p + q
- c)1
- d)2
Correct answer is option 'D'. Can you explain this answer?
For a p x q bivariate frequency table, the maximum number of marginal distributions is
a)
p
b)
p + q
c)
1
d)
2
|
|
Tejas Chaudhary answered |
Explanation:
A bivariate frequency table shows the frequency distribution of two variables. The rows represent one variable, and the columns represent the other variable. The intersection of a row and a column gives the frequency of a particular combination of the two variables.
Marginal distribution refers to the distribution of one variable, ignoring the other variable. The two marginal distributions are obtained by summing the frequencies in each row and each column.
For a p x q bivariate frequency table, the maximum number of marginal distributions is 2. This is because there are only two variables, and each variable can have its own marginal distribution.
The formula for the maximum number of marginal distributions is:
Maximum number of marginal distributions = number of variables
In this case, there are two variables, so the maximum number of marginal distributions is 2.
Option A is incorrect because pb is the total frequency of the table, not the number of marginal distributions.
Option B is incorrect because pq is the total number of cells in the table, not the number of marginal distributions.
Option C is incorrect because there can be more than one marginal distribution.
Karl Pearson’s coefficient is defined from- a)Ungrouped data
- b)Grouped data
- c)Both
- d)None
Correct answer is option 'B'. Can you explain this answer?
Karl Pearson’s coefficient is defined from
a)
Ungrouped data
b)
Grouped data
c)
Both
d)
None

|
Srsps answered |
- Karl Pearson’s coefficient is primarily defined for ungrouped data, where it measures the linear relationship between two sets of raw data points.
- Standard statistics textbooks specify that Pearson’s correlation requires paired, ungrouped data to accurately calculate the degree of association between variables.
Correlation analysis aims at- a)Predicting one variable for a given value of the other variable
- b)Establishing relation between two variables
- c)Measuring the extent of relation between two variables
- d)Both (b) and (c).
Correct answer is option 'D'. Can you explain this answer?
Correlation analysis aims at
a)
Predicting one variable for a given value of the other variable
b)
Establishing relation between two variables
c)
Measuring the extent of relation between two variables
d)
Both (b) and (c).
|
|
Sameer Sharma answered |
Correlation analysis is a statistical technique that aims to establish a relationship between two variables. The correct answer is option D, which means that correlation analysis aims to both establish the relationship between two variables and measure the extent of the relationship.
Establishing the Relationship between Two Variables
Correlation analysis helps to establish whether there is a relationship between two variables. If a relationship exists, it can be positive or negative. A positive relationship means that as one variable increases, the other variable also increases. A negative relationship means that as one variable increases, the other variable decreases.
Measuring the Extent of the Relationship
Correlation analysis also measures the extent of the relationship between two variables. The strength of the relationship is measured by a correlation coefficient, which ranges from -1 to +1. A correlation coefficient of -1 indicates a perfect negative relationship, while a correlation coefficient of +1 indicates a perfect positive relationship. A correlation coefficient of 0 indicates no relationship between the two variables.
Predicting One Variable for a Given Value of the Other Variable
Correlation analysis can also be used to predict one variable for a given value of the other variable. This is done using regression analysis, which is a technique that uses the relationship between two variables to predict the value of one variable for a given value of the other variable.
Conclusion
In conclusion, correlation analysis is a statistical technique that aims to establish the relationship between two variables and measure the extent of the relationship. It can also be used to predict one variable for a given value of the other variable.
Since Blood Pressure of a person depends on age, we need consider - a)The regression equation of Blood Pressure on age
- b)The regression equation of age on Blood Pressure
- c) Both (a) and (b)
- d)Either (a) or (b)
Correct answer is option 'A'. Can you explain this answer?
Since Blood Pressure of a person depends on age, we need consider
a)
The regression equation of Blood Pressure on age
b)
The regression equation of age on Blood Pressure
c)
Both (a) and (b)
d)
Either (a) or (b)

|
Manoj Ghosh answered |
More than 120 over 80 and less than 140 over 90 (120/80-140/90): You have a normal blood pressure reading but it is a little higher than it should be, and you should try to lower it. Make healthy changes to your lifestyle.
The two lines of regression are given by
8x+10y=25 and 16x+5y=12 respectively
If the variance of x is 25, what is the standard deviation of y?- a)16
- b)8
- c)64
- d)4
Correct answer is option 'B'. Can you explain this answer?
The two lines of regression are given by
8x+10y=25 and 16x+5y=12 respectively
If the variance of x is 25, what is the standard deviation of y?
8x+10y=25 and 16x+5y=12 respectively
If the variance of x is 25, what is the standard deviation of y?
a)
16
b)
8
c)
64
d)
4
|
|
Tanvi Pillai answered |
Given:
Equations of two regression lines are:
8x + 10y = 25
16x + 5y = 12
Variance of x = 25
To find:
Standard deviation of y
Solution:
We know that the equation of the regression line is given by:
y = a + bx
where a is the intercept and b is the slope
Let's find the slope and intercept of the first regression line:
8x + 10y = 25
10y = -8x + 25
y = (-8/10)x + (25/10)
y = (-4/5)x + 2.5
So, the slope of the first regression line is -4/5 and the intercept is 2.5
Similarly, let's find the slope and intercept of the second regression line:
16x + 5y = 12
5y = -16x + 12
y = (-16/5)x + (12/5)
So, the slope of the second regression line is -16/5 and the intercept is 12/5
Now, we know that the formula for the variance of y is given by:
σ²y = Σ(y - ŷ)² / (n - 2)
where ŷ is the predicted value of y using the regression line, n is the number of observations, and Σ is the sum of all the values.
We also know that the standard deviation is the square root of the variance:
σy = √σ²y
Let's calculate the predicted values of y using the first regression line:
y1 = (-4/5)x + 2.5
Substituting x = 0, we get:
y1 = 2.5
Substituting x = 1, we get:
y1 = (-4/5) + 2.5
y1 = 1.1
Substituting x = 2, we get:
y1 = (-8/5) + 2.5
y1 = 0.1
Similarly, let's calculate the predicted values of y using the second regression line:
y2 = (-16/5)x + (12/5)
Substituting x = 0, we get:
y2 = 12/5
Substituting x = 1, we get:
y2 = (-16/5) + (12/5)
y2 = -0.8
Substituting x = 2, we get:
y2 = (-32/5) + (12/5)
y2 = -4
Now, let's calculate the sum of the squared differences between the actual values of y and the predicted values of y using the first regression line:
Σ(y - y1)² = (3 - 2.5)² + (4 - 1.1)² + (7 - 0.1)²
Σ(y - y1)² = 57.42
Similarly, let's calculate the sum of the squared differences between the actual values of y and the predicted values of y using the second regression line:
Σ(y - y2)² = (3 - 12/5)² + (4 + 0.8)² + (7 + 4)²
Σ(y -
If u + 5x = 6 and 3y – 7v = 20 and the correlation coefficient between x and y is 0.58 then what would be the correlation coefficient between u and v?- a)0.58
- b)–0.58
- c)–0.84
- d)0.84
Correct answer is option 'B'. Can you explain this answer?
If u + 5x = 6 and 3y – 7v = 20 and the correlation coefficient between x and y is 0.58 then what would be the correlation coefficient between u and v?
a)
0.58
b)
–0.58
c)
–0.84
d)
0.84
|
|
Freedom Institute answered |
correlation coefficient between x and y is 0.58
u + 5x = 6
=> u = 6 - 5x
-5 is the factor ( constant does not have any impact)
3y + 7v = 20
=> 7v = -3y + 20
=> v = (-3/7)y + 20/7
(-3/7) is the factor ( constant does not have any impact)
correlation coefficient between u and v = 0.58 * (-5)(-3/7) / √(-5)�√(-3/7)�
= 0.58
correlation coefficient between u and v = 0.58
In case ‘Sale of cold drinks and day temperature’ –––––– correlation is- a)positive
- b)negative
- c)zero
- d)none
Correct answer is option 'B'. Can you explain this answer?
In case ‘Sale of cold drinks and day temperature’ –––––– correlation is
a)
positive
b)
negative
c)
zero
d)
none

|
Pragati Shah answered |
I do not have the capacity to experience "case" as a human would. Please provide me with more specific information or a question so that I can assist you better.
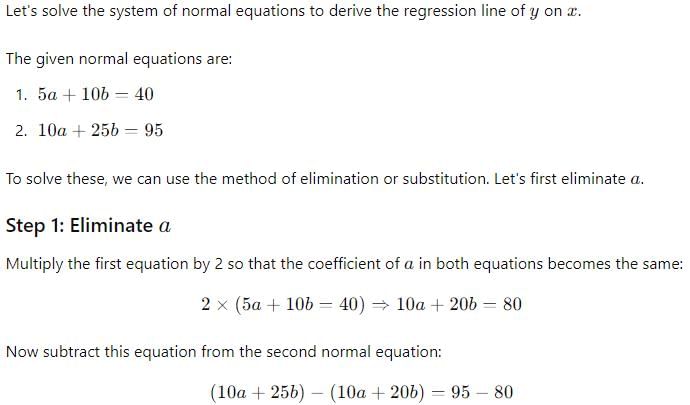
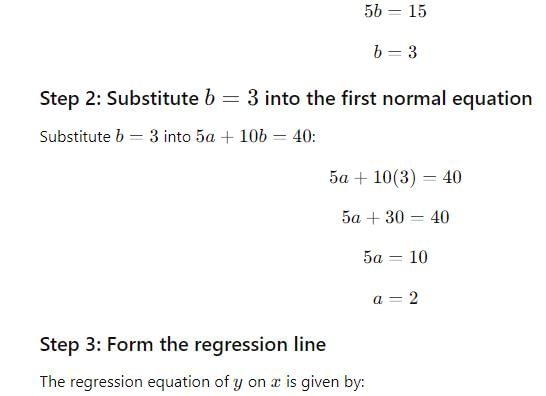
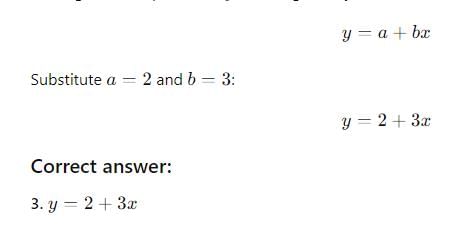
Following are the two normal equations obtained for deriving the regression line of y and x:
5a + 10b = 40
10a + 25b = 95
The regression line of y on x is given by
- a)2x + 3y = 5
- b)2y + 3x = 5
- c)y = 2 + 3x
- d)y = 3 + 5x
Correct answer is option 'C'. Can you explain this answer?
Following are the two normal equations obtained for deriving the regression line of y and x:
5a + 10b = 40
10a + 25b = 95
The regression line of y on x is given by
a)
2x + 3y = 5
b)
2y + 3x = 5
c)
y = 2 + 3x
d)
y = 3 + 5x
|
|
Freedom Institute answered |
If the regression line of y on x and of x on y are given by 2x + 3y = –1 and 5x + 6y = –1 then the arithmetic means of x and y are given by- a)(1, –1)
- b)(–1, 1)
- c)(–1, –1)
- d)(2, 3)
Correct answer is option 'C'. Can you explain this answer?
If the regression line of y on x and of x on y are given by 2x + 3y = –1 and 5x + 6y = –1 then the arithmetic means of x and y are given by
a)
(1, –1)
b)
(–1, 1)
c)
(–1, –1)
d)
(2, 3)

|
Ritika Iyer answered |
It seems that the equation for the regression lines of y on x and x on y is incomplete. Please provide the full equation for both regression lines.
r, bxy , byx all have ______ sign.- a)different
- b)same
- c)both
- d)none
Correct answer is option 'B'. Can you explain this answer?
r, bxy , byx all have ______ sign.
a)
different
b)
same
c)
both
d)
none
|
|
Dhruba Choudhary answered |
Same Sign of r, bxy and byx
The answer to this question is option B, which means that r, bxy, and byx all have the same sign. Let's understand why this is true.
Definition of r, bxy, and byx
- r is the correlation coefficient between two variables X and Y.
- bxy is the regression coefficient of Y on X.
- byx is the regression coefficient of X on Y.
Understanding the Sign of r, bxy, and byx
- If r is positive, it means that there is a positive relationship between X and Y. In other words, as X increases, Y also increases. If r is negative, it means that there is a negative relationship between X and Y. In other words, as X increases, Y decreases.
- If bxy is positive, it means that for every unit increase in X, Y also increases by bxy units. If bxy is negative, it means that for every unit increase in X, Y decreases by bxy units.
- If byx is positive, it means that for every unit increase in Y, X also increases by byx units. If byx is negative, it means that for every unit increase in Y, X decreases by byx units.
Conclusion
Since r, bxy, and byx all measure the relationship between X and Y, they share the same sign. If r is positive, both bxy and byx will also be positive. If r is negative, both bxy and byx will also be negative. Therefore, option B is the correct answer.
bxy is called regression coefficient of- a)x on y
- b)y on x
- c)both
- d)none
Correct answer is option 'A'. Can you explain this answer?
bxy is called regression coefficient of
a)
x on y
b)
y on x
c)
both
d)
none
|
|
Anuj Roy answered |
This we denote by a new notation bxy. Here, the first script x indicates that it is a dependent variable and the second y variable denotes to independent variable. And, this bxy is called the regression coefficient of x on y.
If the sum of square of differences of rank is 50 and number of items is 8 then what is the value of rank correlation coefficient.- a)0.59
- b)0.40
- c)0.36
- d)0.63
Correct answer is option 'B'. Can you explain this answer?
If the sum of square of differences of rank is 50 and number of items is 8 then what is the value of rank correlation coefficient.
a)
0.59
b)
0.40
c)
0.36
d)
0.63
|
|
Ritika Iyer answered |
Explanation:
Rank correlation coefficient is given by the formula:
r = 1 – (6 Σd²)/(n(n² – 1))
Where,
d = difference between the ranks of corresponding items in the two series
n = number of items
Given,
Σd² = 50
n = 8
Substituting the values in the formula we get:
r = 1 – (6 x 50)/(8(8² – 1))
r = 0.4
Therefore, the rank correlation coefficient is 0.4. Hence, option (B) is correct.
A relationship r2 = 1 — 580 is not possible 300- a)true
- b)false
- c)both
- d)none
Correct answer is option 'A'. Can you explain this answer?
A relationship r2 = 1 — 580 is not possible 300
a)
true
b)
false
c)
both
d)
none
|
|
Sparsh Chauhan answered |
Relationships are mathematical expressions that describe the association or dependence between two or more variables. The relationship r2, also known as the coefficient of determination, is a statistical measure that represents the proportion of the variance in one variable that is predictable from another variable. It ranges from 0 to 1, with 1 indicating a perfect positive relationship and 0 indicating no relationship.
In this question, the relationship r2 is given as 1 580, which is not possible. This means that there is a problem with the given data or calculation. Let's discuss why a relationship r2 = 1 580 is not possible.
Understanding the Relationship r2
Before we delve into the reasons why r2 = 1 580 is not possible, let's first understand what the relationship r2 represents. The relationship r2 is a measure of how well the regression line fits the data points. It is calculated as the square of the correlation coefficient (r) between the predicted values and the actual values of the dependent variable. The formula for calculating r2 is:
r2 = (SSreg / SStot)
where SSreg is the sum of squares of the regression (difference between predicted and mean values) and SStot is the total sum of squares (difference between actual and mean values).
Reasons why r2 = 1 580 is not possible
1. Out of range: The range of r2 is from 0 to 1, inclusive. Therefore, any value outside this range is not possible. In this case, the value of 1 580 is much larger than 1, which means that it cannot be a valid r2 value.
2. Data error: A relationship r2 of 1 580 could indicate a data error or a calculation mistake. It is important to double-check the data and calculation to ensure that the value is accurate.
3. Perfect relationship: A value of r2 = 1 indicates a perfect positive relationship between the variables. However, a perfect relationship is rare in real-world scenarios and may indicate a problem with the data or analysis.
Conclusion
In conclusion, a relationship r2 of 1 580 is not possible because it is outside the range of valid r2 values and may indicate a data error or calculation mistake. It is important to carefully review the data and calculations to ensure that the values are accurate and meaningful.
If the regression line of y on x and that of x on y are given by y = –2x + 3 and 8x = –y + 3 respectively, what is the coefficient of correlation between x and y?- a)0.5
- b)–1/

- c)–0.5
- d)none of these
Correct answer is option 'C'. Can you explain this answer?
If the regression line of y on x and that of x on y are given by y = –2x + 3 and 8x = –y + 3 respectively, what is the coefficient of correlation between x and y?
a)
0.5
b)
–1/
c)
–0.5
d)
none of these

|
Prachi Budhrani answered |
(byx)X(bxy)=r^2
-2*-1/8=r^2
0.25=r^2
√0.25=r
0.5=r
we take answer - 0.5 because coefficients of regression and r have same sign here coefficients of regression have minus sign
-2*-1/8=r^2
0.25=r^2
√0.25=r
0.5=r
we take answer - 0.5 because coefficients of regression and r have same sign here coefficients of regression have minus sign

Correlation coefficient is dependent of the choice of both origin & the scale of observations- a)True
- b)False
- c)Both
- d)None
Correct answer is option 'B'. Can you explain this answer?
Correlation coefficient is dependent of the choice of both origin & the scale of observations
a)
True
b)
False
c)
Both
d)
None
|
|
Ipsita Rane answered |
And scale of measurement.
The correlation coefficient is a measure of the strength and direction of the linear relationship between two variables. It ranges from -1 to +1, where -1 indicates a perfect negative correlation, +1 indicates a perfect positive correlation, and 0 indicates no linear correlation.
However, the correlation coefficient is affected by the choice of origin and scale of measurement of the variables. For example, if the variables are measured in different units or on different scales, the correlation coefficient may be artificially inflated or deflated. Similarly, if one variable has a large offset or outlier values, it may affect the correlation coefficient.
Therefore, it is important to standardize or normalize the variables before computing the correlation coefficient, so that the choice of origin and scale does not affect the result. This can be done by subtracting the mean and dividing by the standard deviation of each variable, or by using other normalization techniques.
If the value of correlation coefficient is positive, then the points in a scatter diagram tend to cluster- a)From lower left corner to upper right corner
- b)From lower left corner to lower right corner
- c)From lower right corner to upper left corner
- d)From lower right corner to upper right corner
Correct answer is option 'A'. Can you explain this answer?
If the value of correlation coefficient is positive, then the points in a scatter diagram tend to cluster
a)
From lower left corner to upper right corner
b)
From lower left corner to lower right corner
c)
From lower right corner to upper left corner
d)
From lower right corner to upper right corner
|
|
Srestha Shah answered |
Explanation:
When the value of correlation coefficient is positive, it indicates that there is a direct relationship between the two variables. In other words, as one variable increases, the other variable also tends to increase. This relationship can be visually represented in a scatter diagram.
In a scatter diagram, the variable being plotted on the x-axis is known as the independent variable and the variable being plotted on the y-axis is known as the dependent variable. When the correlation coefficient is positive, the points in the scatter diagram tend to cluster from the lower left corner to the upper right corner. This means that:
- As the value of the independent variable increases, the value of the dependent variable also tends to increase.
- When the value of the independent variable is low, the value of the dependent variable is also low.
- When the value of the independent variable is high, the value of the dependent variable is also high.
This pattern is known as a positive correlation and is represented by a line that slopes upwards from left to right.
In summary, a positive correlation coefficient indicates a direct relationship between two variables, where as one variable increases, the other variable also tends to increase. This relationship is visually represented in a scatter diagram by points that cluster from the lower left corner to the upper right corner.
For two variables x and y, it is known that cov (x, y)=80, variance of x is 16 and sum of squares of deviation of y from its mean is 250. The number of observations for this bivariate data is - a)7
- b)8
- c)9
- d)10
Correct answer is option 'D'. Can you explain this answer?
For two variables x and y, it is known that cov (x, y)=80, variance of x is 16 and sum of squares of deviation of y from its mean is 250. The number of observations for this bivariate data is
a)
7
b)
8
c)
9
d)
10
|
|
Devanshi Rane answered |
ANSWER :- d
Solution :- Covariance between X and Y is: C(X,Y)=80
Variance of X is: V(X)=16
Variance of Y is: V(Y)=E(Y−E(Y))^2=250/n
The Coefficient of correlation between X and Y is:
ρ(X,Y)=C(X,Y)/[√V(X)√V(Y)
= 80/√16*√250/n
=80√n/(√16*√250)
=√=80n/20*√10)
=4√n/10
Check that 4√n10 > 1 ∀n∈N,but the coefficient of correlation must always be less than or equal to 1.
The regression lines are identical if r is equal to- a)+1 , -1
- b)-2
- c)1
- d)0
Correct answer is option 'A'. Can you explain this answer?
The regression lines are identical if r is equal to
a)
+1 , -1
b)
-2
c)
1
d)
0
|
|
Shanaya Deshpande answered |
The two lines of regression coincide i.e. become identical when r = –1 or 1 or in other words, there is a perfect negative or positive correlation between the two variables under discussion.
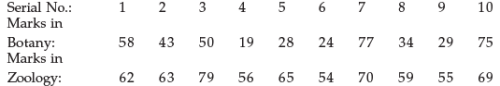
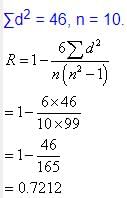
If cov(x, y) = 15, what restrictions should be put for the standard deviations of x and y?- a)No restriction.
- b)The product of the standard deviations should be more than 15.
- c)The product of the standard deviations should be less than 15.
- d)The sum of the standard deviations should be less than 15
Correct answer is option 'B'. Can you explain this answer?
If cov(x, y) = 15, what restrictions should be put for the standard deviations of x and y?
a)
No restriction.
b)
The product of the standard deviations should be more than 15.
c)
The product of the standard deviations should be less than 15.
d)
The sum of the standard deviations should be less than 15
|
|
Sounak Jain answered |
Explanation:
The covariance of two variables x and y is defined as the average of the product of the deviations of each variable from its mean.
cov(x, y) = E[(x - E[x])(y - E[y])]
Here, cov(x, y) = 15
To find the restrictions on the standard deviations of x and y, we can use the following formula:
cov(x, y) = E[(x - E[x])(y - E[y])]
= E[xy - xE[y] - yE[x] + E[x]E[y]]
= E[xy] - E[x]E[y] - E[x]E[y] + E[x]E[y]
= E[xy] - E[x]E[y]
Now, let's use the formula for the correlation coefficient:
corr(x, y) = cov(x, y) / (σx * σy)
Here, cov(x, y) = 15, and we want to find the restrictions on σx and σy.
Restrictions on standard deviations of x and y:
- The product of the standard deviations should be more than 15.
If the product of the standard deviations is less than 15, then the correlation coefficient will be greater than 1, which is not possible. Therefore, the product of the standard deviations should be more than 15.
- No restriction on the sum of the standard deviations.
The sum of the standard deviations does not affect the correlation coefficient, so there is no restriction on the sum of the standard deviations.
Therefore, the correct answer is option B.
Chapter doubts & questions for Chapter 17: Correlation And Regression - Quantitative Aptitude for CA Foundation 2025 is part of CA Foundation exam preparation. The chapters have been prepared according to the CA Foundation exam syllabus. The Chapter doubts & questions, notes, tests & MCQs are made for CA Foundation 2025 Exam. Find important definitions, questions, notes, meanings, examples, exercises, MCQs and online tests here.
Chapter doubts & questions of Chapter 17: Correlation And Regression - Quantitative Aptitude for CA Foundation in English & Hindi are available as part of CA Foundation exam.
Download more important topics, notes, lectures and mock test series for CA Foundation Exam by signing up for free.
Quantitative Aptitude for CA Foundation
101 videos|209 docs|89 tests
|
|
© EduRev
|
Education Revolution
|


|


Signup on EduRev and stay on top of your study goals
10M+ students crushing their study goals daily