


All Exams >
Electrical Engineering (EE) >
Control Systems >
All Questions
All questions of Block Diagrams & Signal Flow Graphs for Electrical Engineering (EE) Exam
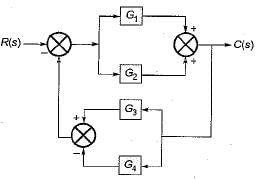
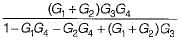
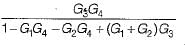
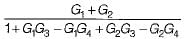
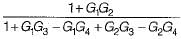
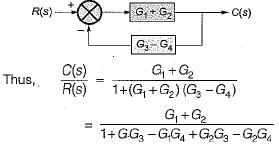
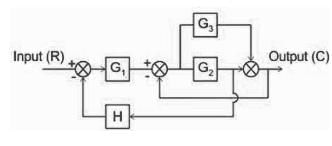
The transfer function C(s)/R(s) for the system described by the block diagram shown below is given by:
- a)

- b)

- c)

- d)None of these
Correct answer is option 'C'. Can you explain this answer?
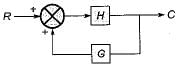
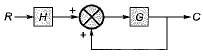
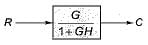
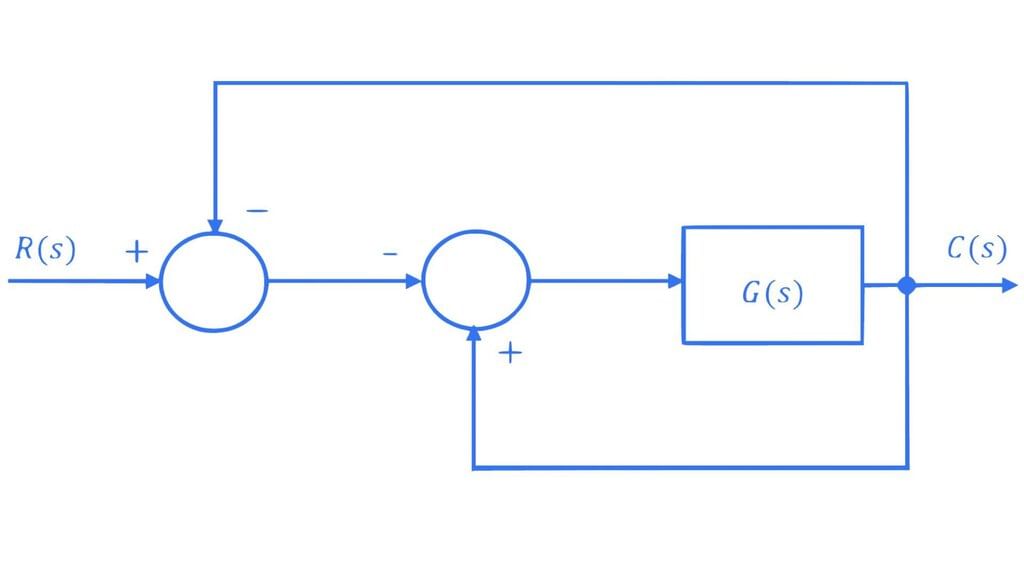
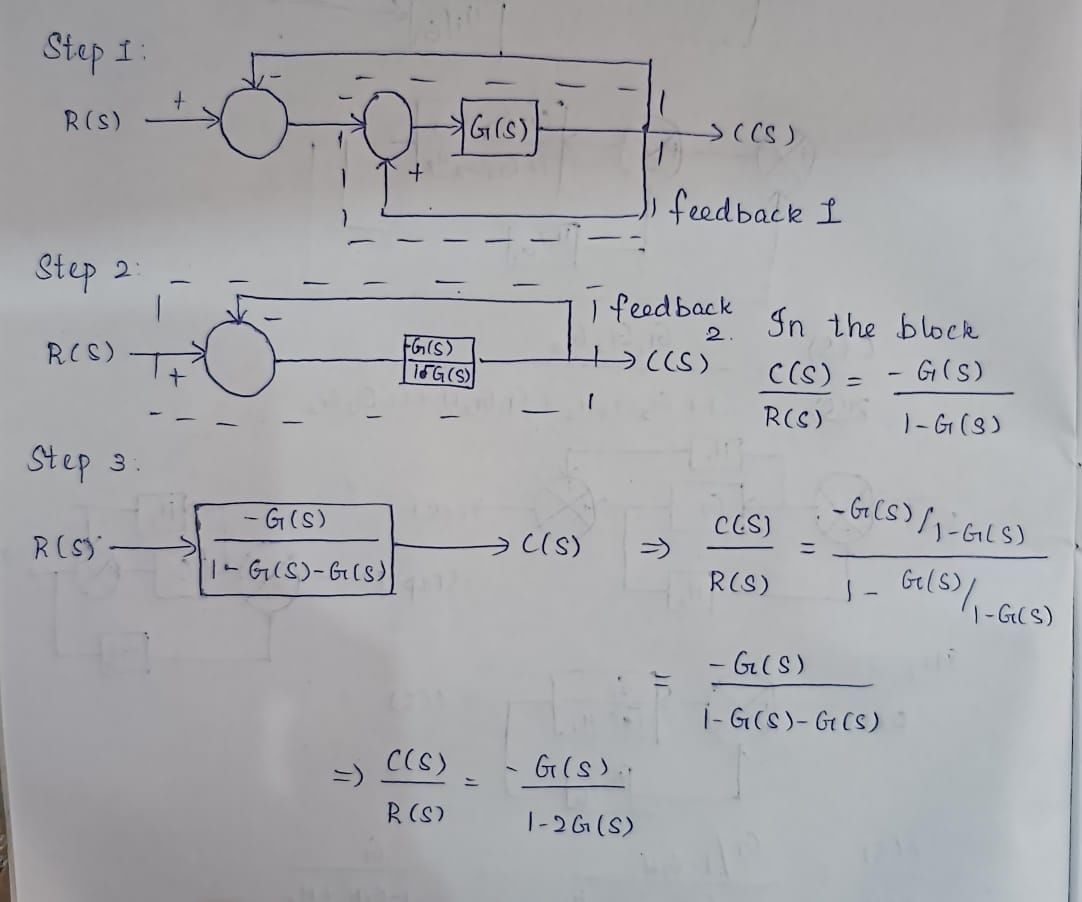
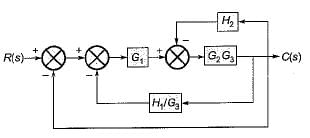
The transfer function C(s)/R(s) for the system described by the block diagram shown below is given by:
a)
b)
c)
d)
None of these
|
|
Rhea Reddy answered |
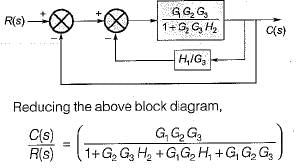
On shifting the take-off point beyond block G, we have the reduced block diagram as shown below:
On further reducing the above block diagram, we get the block diagram as shown below.
On further reducing the above block diagram, we get the block diagram as shown below.

A node having only outgoing branches.
- a)Input node
- b)Output node
- c)Incoming node
- d)Outgoing node
Correct answer is option 'A'. Can you explain this answer?
A node having only outgoing branches.
a)
Input node
b)
Output node
c)
Incoming node
d)
Outgoing node
|
|
Ishani Iyer answered |
Explanation: Nodes are the point by which the branches are outgoing or ingoing and this can be input or output node and input node is the node having only outgoing branches.
Signal flow graphs are reliable to find transfer function than block diagram reduction technique.- a)True
- b)False
Correct answer is option 'A'. Can you explain this answer?
Signal flow graphs are reliable to find transfer function than block diagram reduction technique.
a)
True
b)
False
|
|
Anirban Gupta answered |
Introduction
Signal flow graphs (SFGs) and block diagrams are both tools used in control systems and electrical engineering to represent and analyze systems. However, signal flow graphs provide certain advantages that make them more reliable for finding transfer functions.
Advantages of Signal Flow Graphs
- Visualization of Relationships: SFGs clearly represent the relationships between variables in a system, making it easier to visualize how inputs affect outputs.
- Direct Application of Mason's Gain Formula: Signal flow graphs allow for the direct application of Mason's Gain Formula, which simplifies the calculation of transfer functions by considering all paths and loops in the graph.
- Ease of Handling Complex Systems: For complex systems with multiple feedback loops, SFGs can be more straightforward to analyze, as they do not require tedious block diagram reductions.
- Reduction of Errors: The graphical nature of SFGs helps in minimizing errors that may occur during manual calculations in block diagram reduction.
Block Diagram Limitations
- Complexity in Reduction: Block diagrams often require multiple steps of reduction, which can lead to mistakes and make the process cumbersome, especially for intricate systems.
- Less Intuitive: While block diagrams are useful, they can be less intuitive than SFGs in conveying the overall system dynamics, particularly for those unfamiliar with the method.
Conclusion
In conclusion, while both methods have their uses, signal flow graphs are generally more reliable for finding transfer functions due to their visual clarity, ease of complex system handling, and reduced potential for errors. Thus, the statement is true.
Signal flow graphs:- a)They apply to linear systems
- b)The equation obtained may or may not be in the form of cause or effect
- c)Arrows are not important in the graph
- d)They cannot be converted back to block diagram
Correct answer is option 'A'. Can you explain this answer?
Signal flow graphs:
a)
They apply to linear systems
b)
The equation obtained may or may not be in the form of cause or effect
c)
Arrows are not important in the graph
d)
They cannot be converted back to block diagram
|
|
Mihir Khanna answered |
Explanation: Signal flow graphs are used to find the transfer function of control system by converting the block diagrams into signal flow graphs or directly but cannot be used for nonlinear systems.
The relationship between an input and output variable of a signal flow graph is given by the net gain between the input and output node is known as the overall______________- a)Overall gain of the system
- b)Stability
- c)Bandwidth
- d)Speed
Correct answer is option 'A'. Can you explain this answer?
The relationship between an input and output variable of a signal flow graph is given by the net gain between the input and output node is known as the overall______________
a)
Overall gain of the system
b)
Stability
c)
Bandwidth
d)
Speed
|
|
Vaishnavi Nair answered |
Explanation: The relationship between input and output variable of a signal flow graph is the overall gain of the system.
Signal flow graph is a - a)semilog graph
- b)log-log graph
- c)topological representation of a set of differential equations
- d)a special type of graph for analysis of modern control system
Correct answer is option 'C'. Can you explain this answer?
Signal flow graph is a
a)
semilog graph
b)
log-log graph
c)
topological representation of a set of differential equations
d)
a special type of graph for analysis of modern control system

|
Starcoders answered |
Concept:
- A signal flow graph is a graphical representation of a set of linear algebraic or differential equations. It is a diagram that represents a set of simultaneous linear equations using nodes and directed branches. In control system engineering, signal flow graphs are used to quickly solve the equations related to systems.
- Each node represents a system variable, and each directed branch represents a gain or a multiplication factor between two variables. The direction of the arrow represents the direction of the flow of the signal. The summing and branching points are used to represent system equations in a graphical way.
- Although signal flow graphs are used in the analysis of control systems (option 4), it's not a special type of graph solely for modern control systems. They can be used for a variety of applications involving sets of linear equations, not just modern control systems.
Node:
- A node that has only outgoing branches called input mode
- Which has only incoming branches, known as an output node
- Which has both incoming & outgoing branches, mixed node.
Branch:
- It is an alone segment that joins two nodes.
- It has both gain & direction
Assertion (A): Signal flow graph is applicable to the linear systems.
Reason (R): Signal flow graph method of finding the transfer function of a system is very simple and does not require any reduction technique.- a)Both A and R are true and R is a correct explanation of A.
- b)Both A and R are true but R is not a correct explanation of A.
- c)A is true but R is false.
- d)A is false but R is true.
Correct answer is option 'B'. Can you explain this answer?
Assertion (A): Signal flow graph is applicable to the linear systems.
Reason (R): Signal flow graph method of finding the transfer function of a system is very simple and does not require any reduction technique.
Reason (R): Signal flow graph method of finding the transfer function of a system is very simple and does not require any reduction technique.
a)
Both A and R are true and R is a correct explanation of A.
b)
Both A and R are true but R is not a correct explanation of A.
c)
A is true but R is false.
d)
A is false but R is true.
|
|
Keerthana Pillai answered |
Signal flow graph is applicable to the linear systems because output is proportional to gain of the system
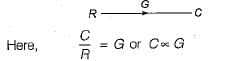
Reason (R) is also true but is not a correct explanation of assertion (A)
Reason (R) is also true but is not a correct explanation of assertion (A)
A signal flow graph is the graphical representation of the relationships between the variables of set linear algebraic equations.- a)True
- b)False
Correct answer is option 'A'. Can you explain this answer?
A signal flow graph is the graphical representation of the relationships between the variables of set linear algebraic equations.
a)
True
b)
False
|
|
Parth Ghoshal answered |
Explanation: By definition signal flow graphs are the graphical representation of the relationships between the variables of set linear algebraic equations.
Loop which do not possess any common node are said to be ___________ loops.- a)Forward gain
- b)Touching loops
- c)Non touching loops
- d)Feedback gain
Correct answer is option 'C'. Can you explain this answer?
Loop which do not possess any common node are said to be ___________ loops.
a)
Forward gain
b)
Touching loops
c)
Non touching loops
d)
Feedback gain
|
|
Srestha Gupta answered |
Non-touching loops are loops in a network that do not share any common node. These loops are important in analyzing feedback systems and determining their stability.
Explanation:
In a network or a system, loops are formed by the branches or paths that connect various nodes. These loops can be interconnected and share common nodes. However, non-touching loops are those loops that do not have any common node between them.
To understand this concept, let's consider an example of a simple electrical network with three loops:
Loop 1: ABCD
Loop 2: DEFC
Loop 3: BEFD
In this example, Loop 1 and Loop 2 share the common node D, while Loop 1 and Loop 3 share the common node B. However, Loop 2 and Loop 3 do not have any common node. Therefore, Loop 2 and Loop 3 are non-touching loops.
Significance:
Non-touching loops are important in analyzing the stability of feedback systems. In feedback systems, loops are formed due to the presence of feedback paths. These loops can have a significant impact on the overall system behavior, including stability and performance.
By analyzing the non-touching loops, engineers can determine the extent to which each loop contributes to the overall system response. This analysis helps in designing and optimizing feedback systems to achieve desired performance and stability criteria.
Loop gain and stability:
In feedback systems, loop gain plays a crucial role in determining stability. Loop gain is the gain around the complete loop formed by the feedback paths. Non-touching loops contribute to the overall loop gain.
When non-touching loops are present in a system, their contributions to the loop gain are multiplied by each other. If the product of the gains of non-touching loops is less than 1, the system is stable. On the other hand, if the product is greater than 1, the system is unstable.
Therefore, analyzing non-touching loops helps in understanding the stability of feedback systems and designing appropriate compensators or control strategies to ensure stability.
In conclusion, non-touching loops in a network or system are loops that do not share any common node. These loops are important in analyzing the stability of feedback systems and determining the overall loop gain. By analyzing the non-touching loops, engineers can optimize feedback systems for desired performance and stability criteria.
Mason's rule is applied to- a)signal flow graph
- b)rotational system
- c)block diagram reduction technique
- d)both (a) and (b)
Correct answer is option 'A'. Can you explain this answer?
Mason's rule is applied to
a)
signal flow graph
b)
rotational system
c)
block diagram reduction technique
d)
both (a) and (b)
|
|
Keerthana Chauhan answered |
Mason's rule or Mason’s gain formula is applied to signal flow graph for finding the transfer function.
Consider the following statements:
1. Transfer function is an expression which relates output to input in s-domain.
2. Transfer function gives information about the internal structure of the system.
3. A system can be represented by the block diagram if the transfer function of the system is known.
4. Block diagram is the flow of system variables from one block to another block represented by a single line.Q. Which of the above statements is/are true?- a)3 and 4 only
- b)1,3 and 4 only
- c)1, 2 and 4 only
- d)1,2, 3 and 4
Correct answer is option 'B'. Can you explain this answer?
Consider the following statements:
1. Transfer function is an expression which relates output to input in s-domain.
2. Transfer function gives information about the internal structure of the system.
3. A system can be represented by the block diagram if the transfer function of the system is known.
4. Block diagram is the flow of system variables from one block to another block represented by a single line.
Q. Which of the above statements is/are true?
a)
3 and 4 only
b)
1,3 and 4 only
c)
1, 2 and 4 only
d)
1,2, 3 and 4
|
|
Bijoy Nair answered |
Transfer function does not gives information about the internal structure of the system. Hence, staement-2 is false.
A node having only outgoing branches.- a)Input node
- b)Output node
- c)Incoming node
- d)Outgoing node
Correct answer is option 'A'. Can you explain this answer?
A node having only outgoing branches.
a)
Input node
b)
Output node
c)
Incoming node
d)
Outgoing node
|
|
Mainak Pillai answered |
Understanding Node Types in Electrical Engineering
In the context of electrical circuits and network theory, nodes represent points where connections occur. Each type of node has specific characteristics based on the flow of current or signals.
Types of Nodes
- Input Node (Correct Answer)
- An input node is characterized by having only outgoing branches. This means that it receives input from other parts of the circuit but does not send any signals to other nodes.
- Typically, it serves as a source of information or energy, directing flow away from itself into the network.
- Output Node
- An output node is the converse of an input node. It has only incoming branches, receiving signals or energy from other nodes.
- It typically represents the end point where information is processed or utilized.
- Incoming Node
- This term generally refers to nodes that receive current or signals from other nodes, indicating they have incoming connections.
- Outgoing Node
- This designation is less common but may refer to nodes that primarily send signals out to other nodes. However, unlike an input node, an outgoing node may also have incoming connections.
Conclusion
In summary, the correct answer is option 'A' because an input node is solely characterized by having outgoing branches, making it integral in defining the flow of current in a network. Understanding these distinctions helps in analyzing circuit behavior and designing effective electrical systems.
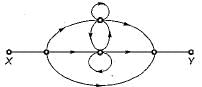
The signal flow graph shown below has M number of forward path and N number of individual loops.
Q. What are the values of M and N ?- a)M= 3 and N= 4
- b)M = 4 and N = 6
- c)M = 3 and N = 6
- d)M = 4 and N =3
Correct answer is option 'A'. Can you explain this answer?
The signal flow graph shown below has M number of forward path and N number of individual loops.
Q. What are the values of M and N ?
Q. What are the values of M and N ?
a)
M= 3 and N= 4
b)
M = 4 and N = 6
c)
M = 3 and N = 6
d)
M = 4 and N =3

|
Gate Gurus answered |
There are three forward paths. The gain of the forward path are:
- M1 = G1G2G3G4G5
- M2 = G1G6G4G5
- M3 = G1G2G7
There are four loops with loop gains:
N1= - G4H1
N1= - G4H1
N2= - G2G7H2
N3= - G6G4G5H2
N4= - G2G3G4G5H2
By performing cascading and/or summing/differencing operations using transfer function blocks G1(s) and G2(s), one CANNOT realize a transfer function of the form- a)G1(s) G2(s)
- b)G1(s) / G2(s)
- c)G1(s)(1/G1(s) + G2(s))
- d)G1(s)(1/G1(s) - G2(s))
Correct answer is option 'B'. Can you explain this answer?
By performing cascading and/or summing/differencing operations using transfer function blocks G1(s) and G2(s), one CANNOT realize a transfer function of the form
a)
G1(s) G2(s)
b)
G1(s) / G2(s)
c)
G1(s)(1/G1(s) + G2(s))
d)
G1(s)(1/G1(s) - G2(s))
|
|
Starcoders answered |
- Realizing Transfer Functions:
You can realize a product of two transfer functions, such as G1(s) G2(s), by cascading systems. - Additive Operations:
Summing or differencing operations allow expressions like G1(s)(1/G1(s) ± G2(s)). - Division Limitation:
Direct division, such as G1(s) / G2(s) (Option B), cannot be realized using only cascading and summing/differencing, since division is not a supported operation in these configurations.
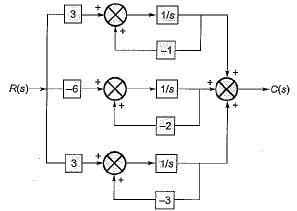
The poles of the transfer function C(s)/R(s) of the system represented by the block diagram shown below are located at
- a)0, -2 and -4
- b)-1, -2 and -4
- c)-2, -3 and -4
- d)-1 , -2 and -3
Correct answer is option 'D'. Can you explain this answer?
The poles of the transfer function C(s)/R(s) of the system represented by the block diagram shown below are located at
a)
0, -2 and -4
b)
-1, -2 and -4
c)
-2, -3 and -4
d)
-1 , -2 and -3
|
|
Saumya Basak answered |
The given block diagram can be reduced as shown below.
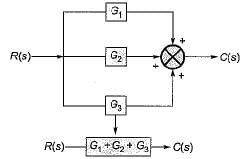
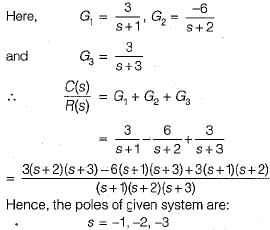
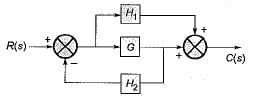
The transfer function C(s) / R(s) for the block diagram shown below is
- a)
- b)
- c)
- d)
Correct answer is option 'C'. Can you explain this answer?
The transfer function C(s) / R(s) for the block diagram shown below is
a)
b)
c)
d)
|
|
Sandeep Saha answered |
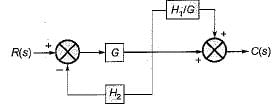
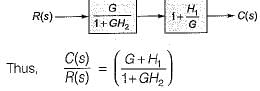
Combining the blocks in parallel, the block diagram is reduced as shown below.
The gain C(s)/R(s) of the signal flow graph shown below is
- a)
- b)
- c)

- d)
Correct answer is option 'D'. Can you explain this answer?
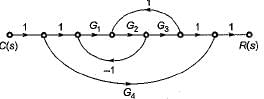
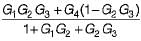
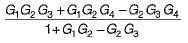
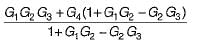
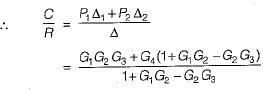
The gain C(s)/R(s) of the signal flow graph shown below is
a)
b)
c)
d)
|
|
Mira Menon answered |
Gain of forward paths are:
P1 = G1G2G3 and P2 = G4
Here, Δ1 = 1
and Δ2 = (1 + G1G2— G2G3)
Individual loops are:
L1 = -G1G2
and L2 = G2G3
Non-touching loop = Nil
P1 = G1G2G3 and P2 = G4
Here, Δ1 = 1
and Δ2 = (1 + G1G2— G2G3)
Individual loops are:
L1 = -G1G2
and L2 = G2G3
Non-touching loop = Nil
Which one of the following block diagrams in options given is equivalent to the below shown block diagram?
- a)
- b)
- c)
- d)None of the above
Correct answer is option 'D'. Can you explain this answer?
Which one of the following block diagrams in options given is equivalent to the below shown block diagram?
a)
b)
c)
d)
None of the above
|
|
Shivam Ghosh answered |
The T.F. of the given block diagram can be reduced to: 
Its block diagram is shown below, where a closed loop feedback system is transformed into an unity feedback system and vice-versa,
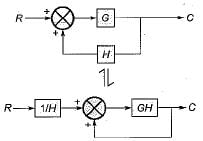
Its block diagram is shown below, where a closed loop feedback system is transformed into an unity feedback system and vice-versa,
Consider the following three cases of signal flow graph and their corresponding transfer functions:
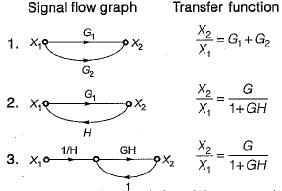
Q. Which of the above relations is/are correctly matched?- a)1 and 2
- b)2 and 3
- c)1 only
- d)1 and 4
Correct answer is option 'C'. Can you explain this answer?
Consider the following three cases of signal flow graph and their corresponding transfer functions:
Q. Which of the above relations is/are correctly matched?
Q. Which of the above relations is/are correctly matched?
a)
1 and 2
b)
2 and 3
c)
1 only
d)
1 and 4
|
|
Shail Kulkarni answered |
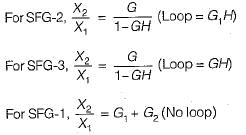
Hence, only 1 is correctly matched.
Use mason’s gain formula to calculate the transfer function of given figure: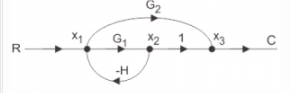
- a)G1/1+G2H
- b)G1+G2/1+G1H
- c)G2/1+G1H
- d)None of the mentioned
Correct answer is option 'B'. Can you explain this answer?
Use mason’s gain formula to calculate the transfer function of given figure:
a)
G1/1+G2H
b)
G1+G2/1+G1H
c)
G2/1+G1H
d)
None of the mentioned
|
|
Swati Shah answered |
Explanation: Use mason’s gain formula to solve the signal flow graph and by using mason’s gain formula transfer function from signal flow graph can be calculated which relates the forward path gain to the various paths and loops.
The signal flow graph for a certain feedback control system is given below.
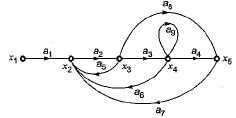
Now, consider the following set of equations for the nodes:
- x2= a1x1+a5x3+a6x4+a7x5
- x3=a2x2
- x4=a3x3
- x5=a4x4+a8x3
Q. Which of the above equations are correct?
- a)1, 2 and 3
- b)1,2 and 4
- c)1,3 and 4
- d)2, 3 and 4
Correct answer is option 'B'. Can you explain this answer?
The signal flow graph for a certain feedback control system is given below.
Now, consider the following set of equations for the nodes:
Now, consider the following set of equations for the nodes:
- x2= a1x1+a5x3+a6x4+a7x5
- x3=a2x2
- x4=a3x3
- x5=a4x4+a8x3
Q. Which of the above equations are correct?
a)
1, 2 and 3
b)
1,2 and 4
c)
1,3 and 4
d)
2, 3 and 4
|
|
Rohan Chavan answered |
Correct Answer :- b
Explanation : x2 = a1x1 + a5x3 + a6x4 + a7x5
x3 = a2x2
x4 a3x3 + a9x5
x5 = a4x4 + a8x3
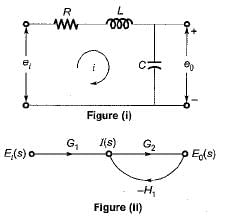
The signal flow graph of the RLC circuit of figure (i) is shown in figure (ii)
The values of G1 and H1 are respectively - a)

- b)

- c)

- d)
Correct answer is option 'A'. Can you explain this answer?
The signal flow graph of the RLC circuit of figure (i) is shown in figure (ii)
The values of G1 and H1 are respectively
The values of G1 and H1 are respectively
a)
b)
c)
d)
|
|
Madhurima Bajaj answered |
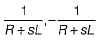
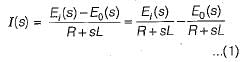
Converting the given circuit in s-domain and writing the equations, we get:
Also, from given SFG, we have
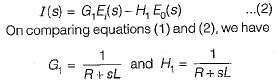
Also, from given SFG, we have
Consider the following statements with regards to the signal flow graph shown below.
1. The number of forward paths are 2.
2. The number of forward paths are 5.
3. The number of loops are 3.
4. The number of loops are 5,
5. The number of non-touching loop pairs is 1.
6. The number of non-touching loop pairs is nil.
Q. Which of these statements are correct?
- a)1,3 and 6
- b)2, 4 and 6
- c) 2, 3 and 5
- d)1 , 4 and 5
Correct answer is option 'C'. Can you explain this answer?
Consider the following statements with regards to the signal flow graph shown below.
1. The number of forward paths are 2.
2. The number of forward paths are 5.
3. The number of loops are 3.
4. The number of loops are 5,
5. The number of non-touching loop pairs is 1.
6. The number of non-touching loop pairs is nil.
1. The number of forward paths are 2.
2. The number of forward paths are 5.
3. The number of loops are 3.
4. The number of loops are 5,
5. The number of non-touching loop pairs is 1.
6. The number of non-touching loop pairs is nil.
Q. Which of these statements are correct?
a)
1,3 and 6
b)
2, 4 and 6
c)
2, 3 and 5
d)
1 , 4 and 5
|
|
Starcoders answered |
Explanation:
- Number of Forward Paths: The number of forward paths can be determined by counting the distinct paths from the input node to the output node. In the given signal flow graph, there are 2 distinct paths from the input to the output, hence statement 1 is correct.
- Number of Loops: Loops are formed when a signal flow graph has a closed path. In the given graph, there are 3 loops, hence statement 3 is correct.
- Number of Non-Touching Loop Pairs: Non-touching loop pairs are pairs of loops that do not share any common nodes. In the given graph, there are 2 non-touching loop pairs, hence statement 5 is incorrect.
Therefore, the correct statements are 1, 3, and 6. So, the correct answer is option C

Use mason’s gain formula to find the transfer function of the given signal flow graph: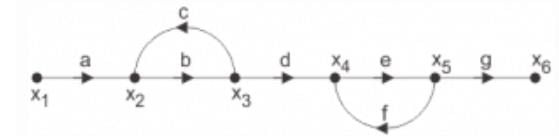
- a)abd/1-(ac)
- b)abdeg/1-(bc+ef)+bcef
- c) abd/1-(bc+ef)+bcef
- d)adcdef/1-(bc+ef)+bcef
Correct answer is option 'B'. Can you explain this answer?
Use mason’s gain formula to find the transfer function of the given signal flow graph:
a)
abd/1-(ac)
b)
abdeg/1-(bc+ef)+bcef
c)
abd/1-(bc+ef)+bcef
d)
adcdef/1-(bc+ef)+bcef
|
|
Sagnik Desai answered |
Explanation: Using mason’s gain formula transfer function from signal flow graph can be calculated which relates the forward path gain to the various paths and loops.
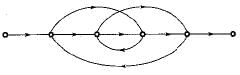
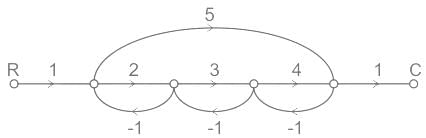
In the signal flow graph of figure given below, the gain C/R will be
- a)11/9
- b)22/15
- c)24/23
- d)44/23
Correct answer is option 'D'. Can you explain this answer?
In the signal flow graph of figure given below, the gain C/R will be
a)
11/9
b)
22/15
c)
24/23
d)
44/23

|
Imtiaz Ahmad answered |
Concept:
Mason’s Gain Formula
- It is a technique used for finding the transfer function of a control system. A formula that determines the transfer function of a linear system by making use of the signal flow graph is known as Mason’s Gain Formula.
- It shows its significance in determining the relationship between input and output.
Suppose there are ‘N’ forward paths in a signal flow graph. The gain between the input and the output nodes of a signal flow graph is nothing but the transfer function of the system. It can be calculated by using Mason’s gain formula.
Mason’s gain formula is
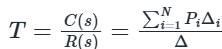
Where,
Where,
C(s) is the output node
R(s) is the input node
T is the transfer function or gain between R(s) and C(s)
Pi is the ith forward path gain
Δ = 1−(sum of all individual loop gains) + (sum of gain products of all possible two non-touching loops) − (sum of gain products of all possible three non-touching loops) + ........
Δi is obtained from Δ by removing the loops which are touching the ith forward path.
Calculations:
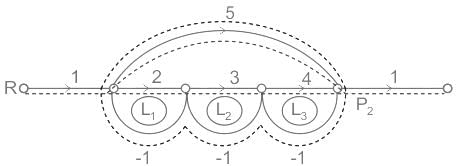
The forward paths are as follows:
P1 = 5
P2 = 2 × 3 × 4 = 24
The loops are as follows:
L1 = -2, L2 = -3, L3 = -4, L4 = -5
The two non-touching loops are:
L1L3 = 8
There is no three non-touching loops
By Mason’s gain formula:-
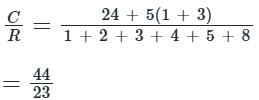
Consider the three block diagrams A, B and C shown below.
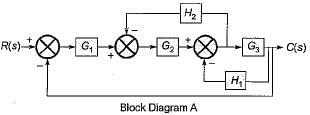
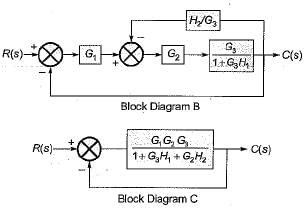
Q. Which one of the following statements is correct in respect of the above block diagrams?- a)A, B and C are equivalent
- b)Only A and B are equivalent
- c)Only B and C are equivalent
- d)Only A and C are equivalent
Correct answer is option 'A'. Can you explain this answer?
Consider the three block diagrams A, B and C shown below.
Q. Which one of the following statements is correct in respect of the above block diagrams?
Q. Which one of the following statements is correct in respect of the above block diagrams?
a)
A, B and C are equivalent
b)
Only A and B are equivalent
c)
Only B and C are equivalent
d)
Only A and C are equivalent
|
|
Avantika Kaur answered |
Shifting the take-off point after block G3 in block diagram-A, the reduced block diagram will be as shown below.
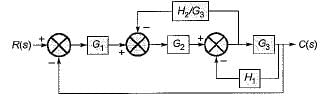
Reducing further, the block diagram is reduced as shown below.
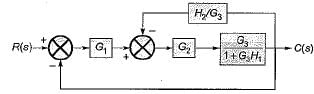
Thus, the block diagrams A and B are equivalent to each other.
On further reducing the block diagram-B, we get the block diagram-C. Hence, all the three block diagrams A, B and C are equivalent to each other,
Reducing further, the block diagram is reduced as shown below.
Thus, the block diagrams A and B are equivalent to each other.
On further reducing the block diagram-B, we get the block diagram-C. Hence, all the three block diagrams A, B and C are equivalent to each other,
The signal flow graph for a system is given below.
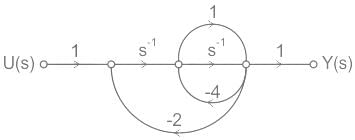
The transfer function Y(s)/U(s) for this system is - a)

- b)

- c)

- d)

Correct answer is option 'A'. Can you explain this answer?
The signal flow graph for a system is given below.
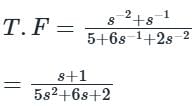
The transfer function Y(s)/U(s) for this system is
The transfer function Y(s)/U(s) for this system is
a)
b)
c)
d)
|
|
Starcoders answered |
Concept:
Signal flow graph
- It is a graphical representation of a set of linear algebraic equations between input and output.
- The set of linear algebraic equations represents the systems.
- The signal flow graphs are developed to avoid mathematical calculation.
Maon gain formula is used to find the ratio of any two nodes or transfer function.
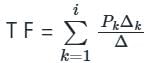
Where Pk = kth forward path gain
Where Pk = kth forward path gain
Δ = 1- ∑ individual loop gain + ∑ two non-touching loops gain - ∑ the gain product of three non-touching loops + ∑ gain of four non-touching loops
Shotcut: while writing Δ take the opposite sign for the odd number of non-touching loops snd the same sign for the even the number of non-touching loops.
ΔK is obtained from Δ by removing the loops touching the Kth forward path.
Calculation:
For the given SFG two forward paths
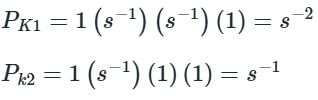
Since all loops are touching the paths PK1 and PK2 so ΔK1 = ΔK2 = 1
We have Δ = 1- ∑ individual loops + ∑ non-touching loops gain
Loops are
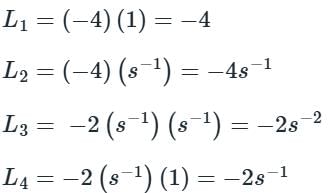
As all the loops are touching each other we have
Δ = 1 – ( L1 + L2 + L3 + L4)
Δ = 1 – ( - 4 – 4s-1 – 2s-2 -2s-1 )
Δ = 5 + 6s-1 + 2s-2
Since all loops are touching the paths PK1 and PK2 so ΔK1 = ΔK2 = 1
We have Δ = 1- ∑ individual loops + ∑ non-touching loops gain
Loops are
As all the loops are touching each other we have
Δ = 1 – ( L1 + L2 + L3 + L4)
Δ = 1 – ( - 4 – 4s-1 – 2s-2 -2s-1 )
Δ = 5 + 6s-1 + 2s-2
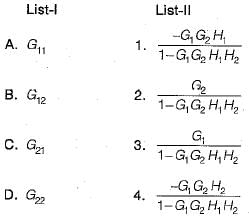
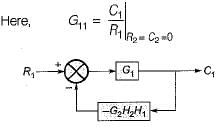
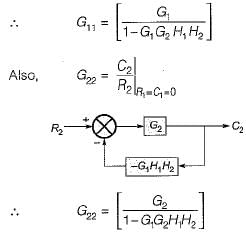
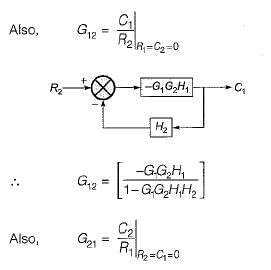
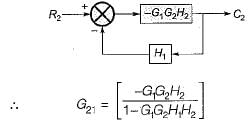
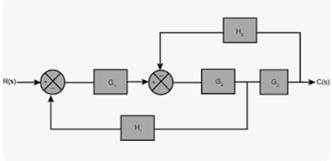
The transfer matrix for the multi input-multi output (MIMO) system represented by the block diagram shown below is given by
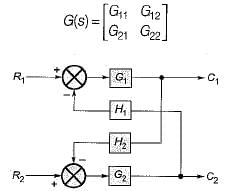
Match List-I with List-II and select the correct answer using the codes given below the lists:
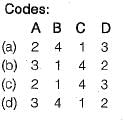
- a)a
- b)b
- c)c
- d)d
Correct answer is option 'B'. Can you explain this answer?
The transfer matrix for the multi input-multi output (MIMO) system represented by the block diagram shown below is given by
Match List-I with List-II and select the correct answer using the codes given below the lists:
Match List-I with List-II and select the correct answer using the codes given below the lists:
a)
a
b)
b
c)
c
d)
d
|
|
Abhay Khanna answered |
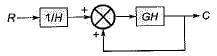
Use mason’s gain formula to calculate the transfer function of given figure: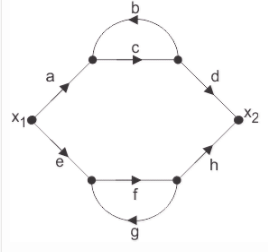
- a)G1/1+G2H
- b)G1+G2/1+G1H
- c)G2/1+G1H
- d)None of the mentioned
Correct answer is option 'A'. Can you explain this answer?
Use mason’s gain formula to calculate the transfer function of given figure:
a)
G1/1+G2H
b)
G1+G2/1+G1H
c)
G2/1+G1H
d)
None of the mentioned
|
|
Ishan Chawla answered |
Explanation: Using mason’s gain formula transfer function from signal flow graph can be calculated which relates the forward path gain to the various paths and loops.


The ratio C(s)/R(s) for the system shown in figure below is
- a)
- b)
- c)
- d)
Correct answer is option 'A'. Can you explain this answer?
The ratio C(s)/R(s) for the system shown in figure below is
a)
b)
c)
d)
|
|
Starcoders answered |
On shifting the take-off point beyond the block G3 and combining blocks G2 and G3, the given block diagram is reduced as shown below.
The block diagram is further reduced as shown below.
The block diagram is further reduced as shown below.
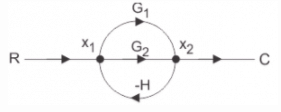
Use mason’s gain formula to find the transfer function of the given figure:
- a)G1+G2
- b)G1+G1/1-G1H+G2H
- c)G1+G2/1+G1H+G2H
- d)G1-G2
Correct answer is option 'C'. Can you explain this answer?
Use mason’s gain formula to find the transfer function of the given figure:
a)
G1+G2
b)
G1+G1/1-G1H+G2H
c)
G1+G2/1+G1H+G2H
d)
G1-G2
|
|
Bhavana Reddy answered |
Explanation: Using mason’s gain formula transfer function from signal flow graph can be calculated which relates the forward path gain to the various paths and loops.
Chapter doubts & questions for Block Diagrams & Signal Flow Graphs - Control Systems 2025 is part of Electrical Engineering (EE) exam preparation. The chapters have been prepared according to the Electrical Engineering (EE) exam syllabus. The Chapter doubts & questions, notes, tests & MCQs are made for Electrical Engineering (EE) 2025 Exam. Find important definitions, questions, notes, meanings, examples, exercises, MCQs and online tests here.
Chapter doubts & questions of Block Diagrams & Signal Flow Graphs - Control Systems in English & Hindi are available as part of Electrical Engineering (EE) exam.
Download more important topics, notes, lectures and mock test series for Electrical Engineering (EE) Exam by signing up for free.
Control Systems
53 videos|115 docs|40 tests
|
|
© EduRev
|
Education Revolution
|


|


Signup to see your scores
go up
within 7 days!
within 7 days!
Takes less than 10 seconds to signup