


All Exams >
Class 5 >
Mathematics for Class 5: NCERT >
All Questions
All questions of Chapter 12 - Smart Charts for Class 5 Exam
Direction: Study the graph and answer the question.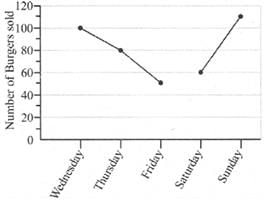 Q. If a profit of Rs. 12 was made for every burger sold, then how much profit was made on Thursday?
- a)Rs. 480
- b)Rs. 690
- c)Rs. 660
- d)Rs. 960
Correct answer is option 'D'. Can you explain this answer?
Direction: Study the graph and answer the question.
Q. If a profit of Rs. 12 was made for every burger sold, then how much profit was made on Thursday?
a)
Rs. 480
b)
Rs. 690
c)
Rs. 660
d)
Rs. 960

|
Edu Impact answered |
On Thursday Total burgers sold = 80
On selling 1 burger profit is = Rs. 12
On selling 80 burgers profit is = Rs. 12 x 80 = Rs.960
On selling 1 burger profit is = Rs. 12
On selling 80 burgers profit is = Rs. 12 x 80 = Rs.960

Direction: The Sine graph shows the quantity of petrol Ankit used and the distance his car travelled. Study the graph answer the question.
 Q. What distance was travelled with 20 litres of petrol?
- a)100 km
- b)250 km
- c)200 km
- d)150 km
Correct answer is option 'A'. Can you explain this answer?
Direction: The Sine graph shows the quantity of petrol Ankit used and the distance his car travelled. Study the graph answer the question.
Q. What distance was travelled with 20 litres of petrol?
a)
100 km
b)
250 km
c)
200 km
d)
150 km

|
Stoneridge Institute answered |
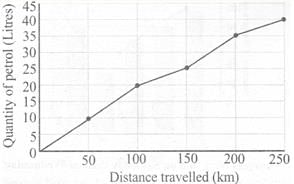
From the given chart, the distance travelled with 20 liters of petrol = 100 km.
Direction: The given bar graph shows the number of residents in 6 cities. Study the graph and answer the question.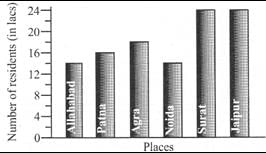 Q. How many residents were there altogether in the 6 cities?
- a)110 lacs
- b)120 lacs
- c)90 lacs
- d)130 lacs
Correct answer is option 'A'. Can you explain this answer?
Direction: The given bar graph shows the number of residents in 6 cities. Study the graph and answer the question.
Q. How many residents were there altogether in the 6 cities?
a)
110 lacs
b)
120 lacs
c)
90 lacs
d)
130 lacs

|
Tutorpedia Coaching answered |
Looking at the height of the bar representing particular city resident mark on the vertical axis
Residents of Allahabad = 14 lacs
Residents of Patna = 16 lacs
Residents of Agra = 18 lacs
Residents of Noida = 14 lacs
Residents of Surat = 24 lacs
Residents of Jaipur = 24 lacs
so the sum total of all the residents will be = 14 lacs + 16 lacs + 18 lacs + 14 lacs + 24 lacs + 24 lacs = 110 lacs
Residents of Allahabad = 14 lacs
Residents of Patna = 16 lacs
Residents of Agra = 18 lacs
Residents of Noida = 14 lacs
Residents of Surat = 24 lacs
Residents of Jaipur = 24 lacs
so the sum total of all the residents will be = 14 lacs + 16 lacs + 18 lacs + 14 lacs + 24 lacs + 24 lacs = 110 lacs
Direction: Study the graph and answer the question.
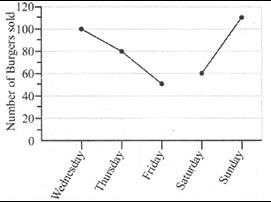 Q. Find the difference between the burgers sold on wednesday and Saturday?
- a)50
- b)40
- c)60
- d)20
Correct answer is option 'B'. Can you explain this answer?
Direction: Study the graph and answer the question.
Q. Find the difference between the burgers sold on wednesday and Saturday?
a)
50
b)
40
c)
60
d)
20

|
Moullik Pandita answered |
in wednesday line the point is thouching the 100's line so,
burgers sold on wednesday = 100
in saturday line the point is touching the 60's line so,
burgers sold on
saturday = 60
therefore , less burgers sold on saturday than on wednesday = 100 - 60 = 40
So B is the correct option

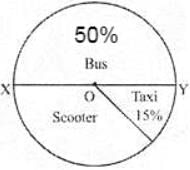
The pie-chart shows the modes of transport used by students of a school. XY is a straight line and O is the centre of the circle. What is the percentage of students who use scooter as a mode of transport?
- a)45
- b)55
- c)100
- d)35
Correct answer is option 'D'. Can you explain this answer?
The pie-chart shows the modes of transport used by students of a school. XY is a straight line and O is the centre of the circle. What is the percentage of students who use scooter as a mode of transport?
a)
45
b)
55
c)
100
d)
35
|
|
Teja Sree answered |
15% of X=45
(15/100)x=45
X=45(100/14)
x=3(100)
x=300
in piechart the students who went in scooter is 35%
because the half of piechart is 50% that means 50%-15%=35%
35%of X=y
(35/100)300=y therefore X=300
(35)3=y
105=y
(15/100)x=45
X=45(100/14)
x=3(100)
x=300
in piechart the students who went in scooter is 35%
because the half of piechart is 50% that means 50%-15%=35%
35%of X=y
(35/100)300=y therefore X=300
(35)3=y
105=y
Direction: The Sine graph shows the quantity of petrol Ankit used and the distance his car travelled. Study the graph answer the question. What distance was travelled with 20 litres of petrol?
- a)50 km
- b)100 km
- c)200 kin
- d)150 km
Correct answer is option 'B'. Can you explain this answer?
Direction: The Sine graph shows the quantity of petrol Ankit used and the distance his car travelled. Study the graph answer the question.
What distance was travelled with 20 litres of petrol?
a)
50 km
b)
100 km
c)
200 kin
d)
150 km
|
|
ナルト answered |
Answer is b
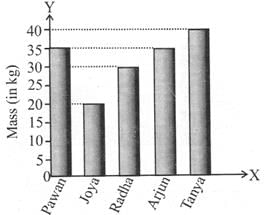
Direction: The bar graph shows the mass of 5 children.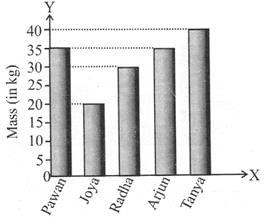 Q. Which of the two children have the same mass?
- a)Pawan and Joya
- b)Pawan and Arjun
- c)Joya and Radha
- d)Arjun and Tanya
Correct answer is option 'B'. Can you explain this answer?
Direction: The bar graph shows the mass of 5 children.
Q. Which of the two children have the same mass?
a)
Pawan and Joya
b)
Pawan and Arjun
c)
Joya and Radha
d)
Arjun and Tanya
|
|
Anand Patel answered |
From the graph, the two bars corresponding to the mass of Pawan and Arjun are of the same height. So, Pawan and Arjun have the same mass.
On which day did the fruit seller earn the most money according to the graph?- a)Monday
- b)Wednesday
- c)Friday
- d)Saturday
Correct answer is option 'D'. Can you explain this answer?
a)
Monday
b)
Wednesday
c)
Friday
d)
Saturday
|
|
Sameer Sengupta answered |
Day of Maximum Earnings
The fruit seller's earnings vary throughout the week, and based on the provided options, Saturday emerges as the day with the highest earnings.
Analysis of Earnings
- On Monday, the fruit seller earned a decent amount, but it was not the highest for the week.
- Wednesday showed a moderate earning level, which was higher than Monday but still below the peak.
- Friday provided a notable increase in earnings, reflecting a busy day for the seller, yet it did not surpass Saturday.
- On Saturday, the fruit seller reached the pinnacle of his earnings, indicating that it was the most profitable day of the week. This could be attributed to various factors including weekend shopping trends, greater foot traffic, or special promotions.
Conclusion
- When comparing the earnings throughout the week, it is clear that Saturday stands out as the day the fruit seller earned the most money.
- Thus, the correct answer is option D: Saturday. This conclusion is drawn from the observation of the earnings trend throughout the week, highlighting Saturday as a key day for increased sales.
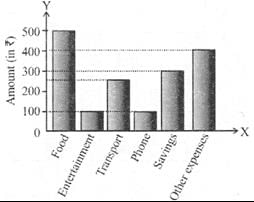
Direction: The graph shows how Lalit spends his pocket money each month.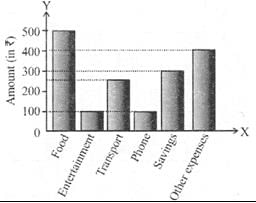 Q. What is the fraction of the amount spent on other expenses to the amount spent on food?
- a)2/3
- b)3/4
- c)4/5
- d)1/3
Correct answer is option 'C'. Can you explain this answer?
Direction: The graph shows how Lalit spends his pocket money each month.
Q. What is the fraction of the amount spent on other expenses to the amount spent on food?
a)
2/3
b)
3/4
c)
4/5
d)
1/3
|
|
Tutorpedia Coaching answered |
Amount of money spent on other expenses = 400
Amount of money spent on food = 500
Fraction = 400/ 500 = 4/5
Amount of money spent on food = 500
Fraction = 400/ 500 = 4/5
Direction: The line graph shows the money earned by a fruit seller during a certain week.
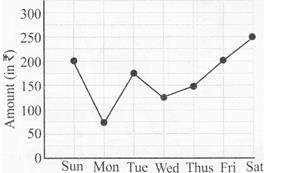
Q. On which day did he earn Rs.75 less than the amount earned on Thursday?- a)Monday
- b)Wednesday
- c)Sunday
- d)Saturday
Correct answer is option 'A'. Can you explain this answer?
Direction: The line graph shows the money earned by a fruit seller during a certain week.
Q. On which day did he earn Rs.75 less than the amount earned on Thursday?
Q. On which day did he earn Rs.75 less than the amount earned on Thursday?
a)
Monday
b)
Wednesday
c)
Sunday
d)
Saturday

|
Shruti Singh answered |
Amount earned on Thursday = Rs. 150
∴ Rs. 75 less than Rs.150 is Rs. 75 = Amount earned on Monday
Direction: The graph shows how Lalit spends his pocket money each month.
 How much does Lalit earn per month?
- a)Rs. 1500
- b)Rs. 1550
- c)Rs. 1600
- d)Rs. 1650
Correct answer is option 'D'. Can you explain this answer?
Direction: The graph shows how Lalit spends his pocket money each month.
How much does Lalit earn per month?
a)
Rs. 1500
b)
Rs. 1550
c)
Rs. 1600
d)
Rs. 1650
|
|
Stoneridge Institute answered |
Total Money= Food+ Entertainment+Transport+Phone+Savings+Other Expenses
= 500+100+250+100+300+400
=1650
= 500+100+250+100+300+400
=1650
Direction: The bar graph shows the mass of 5 children. Q. What is the difference between the mass of the heaviest child and the lightest child?
- a)10 kg
- b)15 kg
- c)20 kg
- d)5 kg
Correct answer is option 'C'. Can you explain this answer?
Direction: The bar graph shows the mass of 5 children.
Q. What is the difference between the mass of the heaviest child and the lightest child?
a)
10 kg
b)
15 kg
c)
20 kg
d)
5 kg
|
|
Akshita Reddy answered |
Mass of the heaviest child = 40 kg Mass of the lightest child = 20 kg Their difference = 20 kg
Direction: The bar graph shows the mass of 5 children.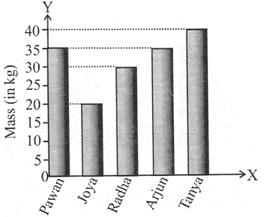
Q. What is the difference between the mass of the heaviest child and the lightest child?- a)10 kg
- b)15 kg
- c)20 kg
- d)5 kg
Correct answer is option 'C'. Can you explain this answer?
Direction: The bar graph shows the mass of 5 children.
Q. What is the difference between the mass of the heaviest child and the lightest child?
a)
10 kg
b)
15 kg
c)
20 kg
d)
5 kg
|
|
Shruti Singh answered |
Mass of the heaviest child = 40 kg Mass of the lightest child = 20 kg Their difference = 20 kg
Direction: The Sine graph shows the quantity of petrol Ankit used and the distance his car travelled. Study the graph answer the question.
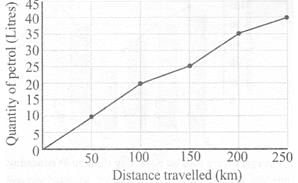 Q. What distance was travelled with 35 litres of petrol?
- a)50 km
- b)75 km
- c)100 km
- d)200 km
Correct answer is option 'D'. Can you explain this answer?
Direction: The Sine graph shows the quantity of petrol Ankit used and the distance his car travelled. Study the graph answer the question.
Q. What distance was travelled with 35 litres of petrol?
a)
50 km
b)
75 km
c)
100 km
d)
200 km
|
|
Tutorpedia Coaching answered |
From the given graph, we can see 35 L of petrol is corresponding to 200 km.
Direction: The line graph shows the money earned by a fruit seller during a certain week.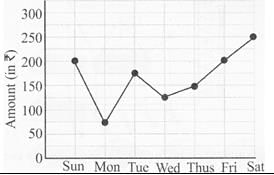 On which day did he earn Rs.75 less than the amount earned on Thursday?
- a)Monday
- b)Wednesday
- c)Sunday
- d)Saturday
Correct answer is option 'A'. Can you explain this answer?
Direction: The line graph shows the money earned by a fruit seller during a certain week.
On which day did he earn Rs.75 less than the amount earned on Thursday?
a)
Monday
b)
Wednesday
c)
Sunday
d)
Saturday
|
|
Akshita Reddy answered |
Amount earned on Thursday = Rs. 150
∴ Rs. 75 less than Rs.150 is Rs. 75 = Amount earned on Monday
Direction: The bar graph shows the mass of 5 children.
Q. Which of the two children have the same mass?- a)Pawan and Joya
- b)Pawan and Arjun
- c)Joya and Radha
- d)Arjun and Tanya
Correct answer is option 'B'. Can you explain this answer?
Direction: The bar graph shows the mass of 5 children.
Q. Which of the two children have the same mass?
Q. Which of the two children have the same mass?
a)
Pawan and Joya
b)
Pawan and Arjun
c)
Joya and Radha
d)
Arjun and Tanya
|
|
Shruti Singh answered |
From the graph, the two bars corresponding to the mass of Pawan and Arjun are of the same height. So, Pawan and Arjun have the same mass.
Chapter doubts & questions for Chapter 12 - Smart Charts - Mathematics for Class 5: NCERT 2025 is part of Class 5 exam preparation. The chapters have been prepared according to the Class 5 exam syllabus. The Chapter doubts & questions, notes, tests & MCQs are made for Class 5 2025 Exam. Find important definitions, questions, notes, meanings, examples, exercises, MCQs and online tests here.
Chapter doubts & questions of Chapter 12 - Smart Charts - Mathematics for Class 5: NCERT in English & Hindi are available as part of Class 5 exam.
Download more important topics, notes, lectures and mock test series for Class 5 Exam by signing up for free.
Mathematics for Class 5: NCERT
31 videos|192 docs|41 tests
|
|
© EduRev
|
Education Revolution
|


|


Signup to see your scores
go up within 7 days!
Access 1000+ FREE Docs, Videos and Tests
Takes less than 10 seconds to signup