


All Exams >
Humanities/Arts >
Online MCQ Tests for Humanities >
All Questions
All questions of Statistics for Economics for Humanities/Arts Exam
Identify the correct statement.
- a)Statistics finds economic relationships using data and verifies them.
- b)Statistics provides tools which are used to predict future value.
- c)Statistical methods help in analysing economic problems.
- d)All of the above
Correct answer is option 'D'. Can you explain this answer?
Identify the correct statement.
a)
Statistics finds economic relationships using data and verifies them.
b)
Statistics provides tools which are used to predict future value.
c)
Statistical methods help in analysing economic problems.
d)
All of the above
|
|
Kiran Mehta answered |
Correct Answer :- d
Explanation : All the statements are correct.
Statistics in economics deals with numbers and is quantitative. Qualitative adjectives like rich, poor, tall etc. have no attached significance in the statistical universe.
Statistics provides tools which are used to predict future value
Statistics only deals with quantitative data it does not deal well with qualitative data beauty, honesty, goodwill etc can’t be measured.
Statistics is an indispensable tool for studying and understanding the economic problems of a country.It helps in analysing economic problems such as production, consumption, pricing, income distribution, population, unemployment and poverty.
| 1 Crore+ students have signed up on EduRev. Have you? Download the App |
Primary data is gathered through- a)original source of information.
- b)information on website.
- c)second hand information.
- d)annual company reports.
Correct answer is option 'A'. Can you explain this answer?
Primary data is gathered through
a)
original source of information.
b)
information on website.
c)
second hand information.
d)
annual company reports.

|
Bhargavi Chopra answered |
A primary data source is an original data source, that is, one in which the data are collected firsthand by the researcher for a specific research purpose or project. Primary data collection is quite expensive and time consuming compared to secondary
The process of buying goods by consumers to satisfy their various needs is- a)satisfaction
- b)utility
- c)consumption
- d)production
Correct answer is option 'C'. Can you explain this answer?
The process of buying goods by consumers to satisfy their various needs is
a)
satisfaction
b)
utility
c)
consumption
d)
production
|
|
Vikas Kapoor answered |
- Consumption, defined as spending for acquisition of utility, is a major concept in economics and is also studied in many other social sciences.
- It is seen in contrast to investing, which is spending for acquisition of future income.
- Consumption, in economics, the use of goods and services by households.
- Consumption is distinct from consumption expenditure, which is the purchase of goods and services for use by households.
Value that divides the series into hundred equal parts is called- a)percentile.
- b)quartiles.
- c)deciles.
- d)octiles.
Correct answer is option 'A'. Can you explain this answer?
Value that divides the series into hundred equal parts is called
a)
percentile.
b)
quartiles.
c)
deciles.
d)
octiles.
|
|
Kiran Mehta answered |
Values that divide the series into hundred equal parts are called percentiles. In percentile, we get 99 dividing positions denoted by P1, P2,……..,P99.
Orderly arrangement of data according to magnitude is called- a)raw series.
- b)individual series.
- c)original series.
- d)listed series.
Correct answer is option 'B'. Can you explain this answer?
Orderly arrangement of data according to magnitude is called
a)
raw series.
b)
individual series.
c)
original series.
d)
listed series.
|
|
Ishan Choudhury answered |
When the raw data is presented individually in the form of a series, it is called an individual series.
In simple words, individual series is the arrangement of raw data individually. It gives numeric values for a specific situation.
In an individual series items are shown separately. So organisation on the basis of magnitude is individual series.
Select the incorrect statement with regard to the study of economics.- a)The study of consumption
- b)The study of production
- c)The study of distribution
- d)The study of investment
Correct answer is option 'D'. Can you explain this answer?
Select the incorrect statement with regard to the study of economics.
a)
The study of consumption
b)
The study of production
c)
The study of distribution
d)
The study of investment
|
|
Om Desai answered |
Economics is generally discussed in three parts: consumption, production and distribution.
There should be free education provided to poor. It is an example of- a)positive science
- b)normative science
- c)economics as an art
- d)science
Correct answer is option 'B'. Can you explain this answer?
There should be free education provided to poor. It is an example of
a)
positive science
b)
normative science
c)
economics as an art
d)
science
|
|
Naina Sharma answered |
There should be free education given to poor. It is an example of normative science as it deals with what should be.
After collection of data, the next step is- a)presentation of data.
- b)classification of data.
- c)selection of data.
- d)categorising of data.
Correct answer is option 'B'. Can you explain this answer?
After collection of data, the next step is
a)
presentation of data.
b)
classification of data.
c)
selection of data.
d)
categorising of data.
|
|
Naina Sharma answered |
Classification is the process of arranging data into different groups or classes.
► Classification of data is done after collection of data.
The data obtained from the records of an organisation is called- a)primary data.
- b)secondary data.
- c)external data.
- d)internal data.
Correct answer is option 'A'. Can you explain this answer?
The data obtained from the records of an organisation is called
a)
primary data.
b)
secondary data.
c)
external data.
d)
internal data.
|
|
Aryan Khanna answered |
Primary data is data that is collected by a researcher from first-hand sources, using methods like surveys, interviews, or experiments. It is collected with the research project in mind, directly from primary sources.
Secondary data is the data that has already been collected through primary sources and made readily available for researchers to use for their own research. A researcher may have collected the data for a particular project, then made it available to be used by another researcher.
So it is a secondary data.
So it is a secondary data.
Data collected from the original source of information is called- a)primary data.
- b)secondary data.
- c)published data.
- d)used data.
Correct answer is option 'A'. Can you explain this answer?
Data collected from the original source of information is called
a)
primary data.
b)
secondary data.
c)
published data.
d)
used data.
|
|
Arun Yadav answered |
These are collected from the very source of information. They are collected for the first time from the original source of information.
The population divided into several homogeneous groups is called
a)Deliberate samplingb)Systematic samplingc)Stratified samplingd)Convenience samplingCorrect answer is option 'C'. Can you explain this answer?
|
|
Kiran Mehta answered |
The correct option is Option C.
Stratified random sampling involves dividing the entire population into homogeneous groups called strata.
Persons doing a particular job are called- a)producers.
- b)businessmen.
- c)service holders.
- d)employers.
Correct answer is option 'C'. Can you explain this answer?
Persons doing a particular job are called
a)
producers.
b)
businessmen.
c)
service holders.
d)
employers.
|
|
Vikas Kapoor answered |
In a job, we work for some other person and are paid for our services. Thus, persons engaged in a particular job are called service holders.
Which of the following is not a measure of central tendency?- a)Mean
- b)Median
- c)Standard deviation
- d)Mode
Correct answer is option 'C'. Can you explain this answer?
Which of the following is not a measure of central tendency?
a)
Mean
b)
Median
c)
Standard deviation
d)
Mode
|
|
Om Desai answered |
► Standard deviation is the measure of how spread out the numbers of a data are.
► Mean is the average.
► Median is the middle number, when data is arranged in numerical order.
► Mode is the data item the appears most frequently.
Mean, median and mode are all measures of central tendencies.
Dividing population into several homogeneous groups for data collection is called- a)deliberate sampling.
- b)stratified sampling.
- c)systematic sampling.
- d)convenience sampling.
Correct answer is option 'C'. Can you explain this answer?
Dividing population into several homogeneous groups for data collection is called
a)
deliberate sampling.
b)
stratified sampling.
c)
systematic sampling.
d)
convenience sampling.
|
|
Ishan Choudhury answered |
The population is divided into homogeneous groups on the basis of their characteristics. It is called systematic sampling.
On the basis of presence and absence of an attribute, data are classified into- a)one fold classification.
- b)two fold classification.
- c)three fold classification.
- d)four fold classification.
Correct answer is option 'B'. Can you explain this answer?
On the basis of presence and absence of an attribute, data are classified into
a)
one fold classification.
b)
two fold classification.
c)
three fold classification.
d)
four fold classification.

|
Sunil Chahar answered |
When on the basis presence and absence of an attribute, the data are classified into two classes, one possessing that attribute and the other not possessing that attribute, it is called two-fold classification.
Arithmetic mean is of- a)two types.
- b)three types.
- c)four types.
- d)five types.
Correct answer is option 'A'. Can you explain this answer?
Arithmetic mean is of
a)
two types.
b)
three types.
c)
four types.
d)
five types.
|
|
Tejas Verma answered |
Arithmetic mean is of two types:
- Simple arithmetic mean
- Weighted mean.
Data can be represented in
- a)one way.
- b)two ways.
- c)four ways.
- d)three ways.
Correct answer is option 'D'. Can you explain this answer?
Data can be represented in
a)
one way.
b)
two ways.
c)
four ways.
d)
three ways.
|
|
Pranjli Dixit answered |
Two ways
first as primary data
and second as secondary data
first as primary data
and second as secondary data
Each given interval is called a- a)frequency.
- b)series.
- c)class.
- d)distribution.
Correct answer is option 'C'. Can you explain this answer?
Each given interval is called a
a)
frequency.
b)
series.
c)
class.
d)
distribution.
|
|
Poonam Reddy answered |
Difference between upper and lower class limit is called class interval.
For example, 0-10, 10-20, 20-30 etc.
The quantitative character of an item is shown by- a)attributes.
- b)variables.
- c)figures.
- d)tables.
Correct answer is option 'B'. Can you explain this answer?
The quantitative character of an item is shown by
a)
attributes.
b)
variables.
c)
figures.
d)
tables.
|
|
Poonam Reddy answered |
Heights and weights of individuals are variables as they can be measured in numerical terms. Thus, variables are used when changing characterstics are numerically measured.
Which of the following is/are an example/s of weighted price index?
(a) Consumer price index
(b) Wholesale price index
(c) Sensex- a)(a) and (b)
- b)(b) and (c)
- c)Only (a)
- d)All (a), (b) and (c)
Correct answer is option 'D'. Can you explain this answer?
Which of the following is/are an example/s of weighted price index?
(a) Consumer price index
(b) Wholesale price index
(c) Sensex
(a) Consumer price index
(b) Wholesale price index
(c) Sensex
a)
(a) and (b)
b)
(b) and (c)
c)
Only (a)
d)
All (a), (b) and (c)
|
|
Gaurav Kumar answered |
The following are examples of weighted price index:
(a) Consumer price index
(b) Wholesale price index
(c) Sensex
(a) Consumer price index
(b) Wholesale price index
(c) Sensex
In case the interviewer is unable to contact a person, it is called- a)sampling bias.
- b)non-response error.
- c)non-sampling error.
- d)error of calculation.
Correct answer is option 'B'. Can you explain this answer?
In case the interviewer is unable to contact a person, it is called
a)
sampling bias.
b)
non-response error.
c)
non-sampling error.
d)
error of calculation.

|
Puja Das answered |
Non-response errors occur when the respondent refuses to respond or the person refuses to provide information.
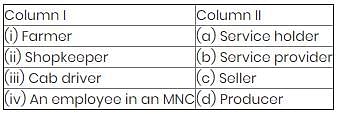
Match the column I and II and choose the correct pair of statements:
- a)(iv)-(a), (i)-(b), (iii)-(c) and (ii)-(d)
- b)(iv)-(a), (i)-(b), (ii)-(c) and (iii)-(d)
- c)(iv)-(a), (iii)-(b), (ii)-(c) and (i)-(d)
- d)(iv)-(a), (ii)-(b), (iii)-(c) and (i)-(d)
Correct answer is option 'C'. Can you explain this answer?
Match the column I and II and choose the correct pair of statements:
a)
(iv)-(a), (i)-(b), (iii)-(c) and (ii)-(d)
b)
(iv)-(a), (i)-(b), (ii)-(c) and (iii)-(d)
c)
(iv)-(a), (iii)-(b), (ii)-(c) and (i)-(d)
d)
(iv)-(a), (ii)-(b), (iii)-(c) and (i)-(d)
|
|
Om Desai answered |
A farmer is a person engaged in agriculture, raising living organisms for food or raw materials.So he is a producer .
A shopkeeper is an individual who owns or runs a shop.A shopkeeper sells some items. So he is a seller.
A service holder is a person who takes service or that he is working under someone. This means employee and the service provider is the person who gives job(employer). So service holder is employee.
A service provider is a company that provides organizations with consulting, legal, real estate, education, communications, storage, processing, transport, and many other services. So the service provider is the cab driver.
To calculate purchasing power of money and real wages we use- a)income index.
- b)consumer price index.
- c)wholesale price index.
- d)retail price index.
Correct answer is option 'B'. Can you explain this answer?
To calculate purchasing power of money and real wages we use
a)
income index.
b)
consumer price index.
c)
wholesale price index.
d)
retail price index.
|
|
Aryan Khanna answered |
Consumer price index number or cost of living index helps in measuring the changes in the purchasing power of money and real income.
The subject that helps in analysing economic problems and formulating policies to solve them is- a)Physics.
- b)Chemistry
- c)Mathematics.
- d)Statistics.
Correct answer is option 'D'. Can you explain this answer?
The subject that helps in analysing economic problems and formulating policies to solve them is
a)
Physics.
b)
Chemistry
c)
Mathematics.
d)
Statistics.
|
|
Nimmi answered |
Statistics is the subject which deals with analysing economic problem and formulating policies using quantitative data.
People engaged in adding value to the matter are called- a)consumers
- b)sellers
- c)producers
- d)service provider
Correct answer is option 'C'. Can you explain this answer?
People engaged in adding value to the matter are called
a)
consumers
b)
sellers
c)
producers
d)
service provider

|
Raman Singh answered |
A producer produces goods for consumption. The process of adding value to a matter is known as production.
Qualitative expressions are outside the scope of statistics unless they are expressed in
- a)Quantitative terms
- b)Algebraic terms
- c)Qualitative terms
- d)Java terms
Correct answer is option 'A'. Can you explain this answer?
Qualitative expressions are outside the scope of statistics unless they are expressed in
a)
Quantitative terms
b)
Algebraic terms
c)
Qualitative terms
d)
Java terms

|
Fatema Dholkawala Dholka answered |
Correct answer is c
statistics only deals with numbers.
it ignores qualitative aspects of the data
statistics only deals with numbers.
it ignores qualitative aspects of the data
Direction: In the following questions, a statement of Assertion (A) is followed by a statement of Reason (R). Mark the correct choice as:Assertion (A): For calculating Arithmetic mean, when Cumulative frequencies are given, the frequencies are to be found for the given series or variables.Reason (R): Cumulative frequencies are calculated by adding the frequencies.- a)Both Assertion (A) and Reason (R) are true, and Reason (R) is the correct explanation of the Assertion (A).
- b)Both Assertion (A) and Reason (R) are true, but Reason (R) is not the correct explanation of the Assertion (A).
- c)Assertion (A) is true, but Reason (R) is false.
- d)Assertion (A) is false, but Reason (R) is true.
Correct answer is option 'B'. Can you explain this answer?
Direction: In the following questions, a statement of Assertion (A) is followed by a statement of Reason (R). Mark the correct choice as:
Assertion (A): For calculating Arithmetic mean, when Cumulative frequencies are given, the frequencies are to be found for the given series or variables.
Reason (R): Cumulative frequencies are calculated by adding the frequencies.
a)
Both Assertion (A) and Reason (R) are true, and Reason (R) is the correct explanation of the Assertion (A).
b)
Both Assertion (A) and Reason (R) are true, but Reason (R) is not the correct explanation of the Assertion (A).
c)
Assertion (A) is true, but Reason (R) is false.
d)
Assertion (A) is false, but Reason (R) is true.
|
|
Arun Yadav answered |
The arithmetic mean of the following observation 4, 8, 12, 16, is 10. 3. Cumulative frequency is needed while finding the median of the distribution. In case of calculation of median after arranging the data in ascending or descending order, the cumulative frequencies are calculated.
The mathematical average is also called- a)median.
- b)mode.
- c)mean.
- d)quartile.
Correct answer is option 'C'. Can you explain this answer?
The mathematical average is also called
a)
median.
b)
mode.
c)
mean.
d)
quartile.
|
|
Tejas Verma answered |
► Mean is a mathematical average.
The arithmetic mean or mean is defined as the sum of values of a group of items divided by the number of items. It is denoted by mean.
More than one attribute are present simultaneously in case of- a)qualitative classification.
- b)quantitative classification.
- c)manifold classification.
- d)chronological classification.
Correct answer is option 'C'. Can you explain this answer?
More than one attribute are present simultaneously in case of
a)
qualitative classification.
b)
quantitative classification.
c)
manifold classification.
d)
chronological classification.
|
|
Vikas Kapoor answered |
In manifold classification, two or more attributes are considered simultaneously. When more attributes are involved, the data would be classified into several classes and subclasses depending on the number of attributes.
For example, the population in a country can be classified in terms of gender as male and female.
For example, the population in a country can be classified in terms of gender as male and female.
The correct option is Option C
Classification of data is the grouping of raw data under different- a)headings
- b)rows
- c)columns
- d)tables
Correct answer is option 'A'. Can you explain this answer?
Classification of data is the grouping of raw data under different
a)
headings
b)
rows
c)
columns
d)
tables
|
|
Vikas Kapoor answered |
Classification is concerned with the division of the data into various groups and sub groups.
► Data is classified into groups of different headings.
In singular sense statistics is- a)applied science.
- b)descriptive science.
- c)social science.
- d)normative science.
Correct answer is option 'A'. Can you explain this answer?
In singular sense statistics is
a)
applied science.
b)
descriptive science.
c)
social science.
d)
normative science.
|
|
Aryan Khanna answered |
In singular sense the term statistics means statistical methods. Statistics is an applied science in singular sense.
Expands CSO.- a)Central Statistics Office
- b)Central Statistical organisation
- c)Central Statistics organisation
- d)Central Statistical office
Correct answer is option 'A'. Can you explain this answer?
Expands CSO.
a)
Central Statistics Office
b)
Central Statistical organisation
c)
Central Statistics organisation
d)
Central Statistical office
|
|
Gaurav Kumar answered |
The CSO, Central statistics Office is responsible for conducting statistical activities in the economy.
A sample which is capable of providing reasonably accurate information about the population at a much lower cost and shorter time is known as- a)sample unit
- b)sample frame
- c)random sample
- d)representative sample
Correct answer is option 'D'. Can you explain this answer?
A sample which is capable of providing reasonably accurate information about the population at a much lower cost and shorter time is known as
a)
sample unit
b)
sample frame
c)
random sample
d)
representative sample

|
Sushil Ku answered |
A good sample is one which is smaller than the population and is capable of providing reasonable accurate information about the population at a much lower cost and in shorter span of time. This kind of a sample is also known as representative sample.
Which of the following is not a manifestations of scarcity?- a)Long queues at railway booking counters
- b)Crowded buses
- c)Shortage of essential commodities
- d)Sunlight
Correct answer is option 'D'. Can you explain this answer?
Which of the following is not a manifestations of scarcity?
a)
Long queues at railway booking counters
b)
Crowded buses
c)
Shortage of essential commodities
d)
Sunlight
|
|
Hardik Handa answered |
The examples of scarcity are long queues at railway booking counters, crowded buses and trains, shortage of essential commodities etc.
Identify the correct pair of terms with their formula from the following Columns I and II: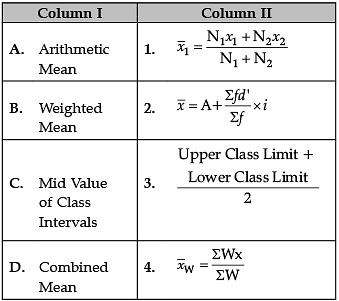
- a)A–1
- b)B–2
- c)C–3
- d)D–4
Correct answer is option 'C'. Can you explain this answer?
Identify the correct pair of terms with their formula from the following Columns I and II:
a)
A–1
b)
B–2
c)
C–3
d)
D–4

|
Notes Wala answered |
Correct Formulas are
A. Arithmetic Mean: 
B. Weighted Mean: 
C. Mid Value of Class Intervals: 
D. Combined Mean: 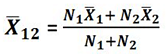
Direction: In the following questions, a statement of Assertion (A) is followed by a statement of Reason (R). Mark the correct choice as:Assertion (A): The Index Number shows the change in the relative price from the base year.Reason (R): Index number is calculated as a ratio of current price with the base price.- a)Both Assertion (A) and Reason (R) are true, and Reason (R) is the correct explanation of the Assertion (A).
- b)Both Assertion (A) and Reason (R) are true, but Reason (R) is not the correct explanation of the Assertion (A).
- c)Assertion (A) is true, but Reason (R) is false.
- d)Assertion (A) is false, but Reason (R) is true.
Correct answer is option 'B'. Can you explain this answer?
Direction: In the following questions, a statement of Assertion (A) is followed by a statement of Reason (R). Mark the correct choice as:
Assertion (A): The Index Number shows the change in the relative price from the base year.
Reason (R): Index number is calculated as a ratio of current price with the base price.
a)
Both Assertion (A) and Reason (R) are true, and Reason (R) is the correct explanation of the Assertion (A).
b)
Both Assertion (A) and Reason (R) are true, but Reason (R) is not the correct explanation of the Assertion (A).
c)
Assertion (A) is true, but Reason (R) is false.
d)
Assertion (A) is false, but Reason (R) is true.
|
|
Ishan Choudhury answered |
Index number in statistics is the measurement of change in a variable or variables across a determined period. It will show general relative change and not a directly measurable figure. An index number is expressed in percentage form.
The value of coefficient of correlation is unaffected by- a)position of origin.
- b)change of origin.
- c)position of values.
- d)change of values.
Correct answer is option 'B'. Can you explain this answer?
The value of coefficient of correlation is unaffected by
a)
position of origin.
b)
change of origin.
c)
position of values.
d)
change of values.

|
Athul Yadav answered |
The value of coefficient of correlation is unaffected by change of origin. Correlation coeffecient always remains between -1 and +1.
Arranging of data in the given series is required while computing- a)mean.
- b)median.
- c)mode.
- d)quartile.
Correct answer is option 'B'. Can you explain this answer?
Arranging of data in the given series is required while computing
a)
mean.
b)
median.
c)
mode.
d)
quartile.

|
Jatin Singh answered |
Calculation of median requires arranging of data in ascending or descending order before calculating mean. It can also be located graphically.
Temporal classification is done on the basis of- a)place.
- b)time.
- c)quality.
- d)quantity.
Correct answer is option 'B'. Can you explain this answer?
Temporal classification is done on the basis of
a)
place.
b)
time.
c)
quality.
d)
quantity.

|
Chan singh answered |
When classification is done on the basis of time, the classification is known as temporal classification. Time may be in hours, days, weeks, months, years etc.
Commodities are broadly classified into three categories namely primary articles, fuel, power, light and lubricants and manufactured products to calculate- a)Income Index Number.
- b)Consumer Price Index.
- c)Wholesale Price Index.
- d)Production Index.
Correct answer is option 'C'. Can you explain this answer?
Commodities are broadly classified into three categories namely primary articles, fuel, power, light and lubricants and manufactured products to calculate
a)
Income Index Number.
b)
Consumer Price Index.
c)
Wholesale Price Index.
d)
Production Index.

|
Uday Chakraborty answered |
Wholesale Price Index (WPI)
WPI is a measure of the change in the price of goods sold in wholesale markets. It is used to calculate the inflation rate and is an important indicator of the economic situation of a country. The WPI is calculated by taking the average of the prices of a basket of goods that are sold in wholesale markets.
Classification of Commodities
Commodities are broadly classified into three categories, namely:
1. Primary Articles - These are the raw materials that are used in the production of goods. Examples include food grains, vegetables, fruits, milk, etc.
2. Fuel, Power, Light, and Lubricants - These are the commodities that are used as energy sources. Examples include coal, petroleum, electricity, etc.
3. Manufactured Products - These are the finished goods that are produced from raw materials. Examples include textiles, machinery, chemicals, etc.
WPI Calculation
The WPI is calculated by taking into account the prices of goods in each of these categories. The prices are weighted according to the importance of each commodity in the economy. The weightage of different commodities is based on their share in the total value of production.
Therefore, the correct option is C, as the Wholesale Price Index is used to calculate the inflation rate and is based on the prices of goods in each of the three categories of commodities.
Line frequency graph is suitable for presenting- a)continuous variables.
- b)discrete variables.
- c)constant variable.
- d)proportionate variable.
Correct answer is option 'B'. Can you explain this answer?
Line frequency graph is suitable for presenting
a)
continuous variables.
b)
discrete variables.
c)
constant variable.
d)
proportionate variable.
|
|
Om Desai answered |
Line frequency graph is obtained from the frequency distribution of discrete variables. Length of the line represents the frequency of that variable.
Direction: In the following questions, a statement of Assertion (A) is followed by a statement of Reason (R). Mark the correct choice as:Assertion (A): Scatter Diagram method is a graphic expression of the degree and direction or absence of correlation.Reason (R): Scatter Diagram method fails to produce definite trend.- a)Both Assertion (A) and Reason (R) are true, and Reason (R) is the correct explanation of the Assertion (A).
- b)Both Assertion (A) and Reason (R) are true, but Reason (R) is not the correct explanation of the Assertion (A).
- c)Assertion (A) is true, but Reason (R) is false.
- d)Assertion (A) is false, but Reason (R) is true.
Correct answer is option 'B'. Can you explain this answer?
Direction: In the following questions, a statement of Assertion (A) is followed by a statement of Reason (R). Mark the correct choice as:
Assertion (A): Scatter Diagram method is a graphic expression of the degree and direction or absence of correlation.
Reason (R): Scatter Diagram method fails to produce definite trend.
a)
Both Assertion (A) and Reason (R) are true, and Reason (R) is the correct explanation of the Assertion (A).
b)
Both Assertion (A) and Reason (R) are true, but Reason (R) is not the correct explanation of the Assertion (A).
c)
Assertion (A) is true, but Reason (R) is false.
d)
Assertion (A) is false, but Reason (R) is true.

|
Nandini Chakraborty answered |
Assertion (A) Explained
The Assertion states that the Scatter Diagram method visually represents the degree, direction, or absence of correlation between two variables.
- Graphic Representation: Scatter diagrams plot individual data points on a two-dimensional graph, allowing for the visualization of relationships.
- Degree of Correlation: The closeness of the points to a line indicates the strength of the correlation—whether strong, weak, or nonexistent.
Reason (R) Explained
The Reason claims that the Scatter Diagram method fails to produce a definite trend.
- Trend Identification: While scatter diagrams do not always reveal a clear trend, they can still indicate correlations. A trend line can be fitted to identify patterns.
- Limitations: It is crucial to understand that scatter diagrams may not always provide a clear trend without further statistical analysis.
Correct Option Justification
The correct answer is option 'B' because:
- Both Statements are True: Both Assertion (A) and Reason (R) are accurate in their claims.
- Reason is Not an Explanation: However, Reason (R) does not explain Assertion (A). The scatter diagram can indicate correlations despite not always showing a clear or definite trend.
In summary, while both the assertion and reason are correct, the reason does not clarify or justify the assertion, making option 'B' the correct choice.
If the CPI (2000 = 100), is 234 in January 2012, the equivalent of a rupee in January, 2012 is- a)0.427
- b)0.827
- c)0.477
- d)0.423
Correct answer is option 'A'. Can you explain this answer?
If the CPI (2000 = 100), is 234 in January 2012, the equivalent of a rupee in January, 2012 is
a)
0.427
b)
0.827
c)
0.477
d)
0.423

|
Jatin Sharma answered |
Calculation using CPI
To calculate the equivalent value of a rupee in January 2012, we need to use the CPI (Consumer Price Index) as a reference. The CPI measures the average change in prices paid by consumers for goods and services over time. In this case, the base year for the CPI is 2000, and the index value for January 2012 is 234.
Formula
The formula to calculate the equivalent value of a rupee in January 2012 using the CPI is:
Equivalent value = (CPI in base year / CPI in current year) x value in base year
where value in base year is 1 rupee in this case.
Calculation of equivalent value
Using the formula, we get:
Equivalent value = (100/234) x 1
Equivalent value = 0.427
Therefore, the equivalent value of a rupee in January 2012 is 0.427. This means that the purchasing power of a rupee in January 2012 was about 42.7% of what it was in the base year of 2000.
The following are the precautions that are to be followed while using secondary data- a)reliability
- b)adequacy
- c)suitability of data
- d)hastily
Correct answer is option 'D'. Can you explain this answer?
The following are the precautions that are to be followed while using secondary data
a)
reliability
b)
adequacy
c)
suitability of data
d)
hastily

|
Rishabh Das answered |
Before using the secondary data the investigator should take the precaution of the reliability, adequacy and suitability of thedata.
IIP i.e. industrial index of production includes- a)only production of the private sectors
- b)only production of the public sectors
- c)production of the public and private sector
- d)Primary sector
Correct answer is option 'C'. Can you explain this answer?
IIP i.e. industrial index of production includes
a)
only production of the private sectors
b)
only production of the public sectors
c)
production of the public and private sector
d)
Primary sector
|
|
Sunil Chahar answered |
IIP measures the changes in the level of industrial production comprising many industries.
Arrangement of data into different groups is known as- a)collection of data
- b)presentation of data.
- c)pictograph
- d)classification
Correct answer is option 'D'. Can you explain this answer?
Arrangement of data into different groups is known as
a)
collection of data
b)
presentation of data.
c)
pictograph
d)
classification
|
|
Om Desai answered |
Classification is the process of arranging things (either actually or notionally) in the groups according to their resemblances and affinities and gives expression to the unity of attributes that may subsist amongst a diversity of individuals.
Data classified according to some characteristics that are capable of direct measurement is calleda) quantitative classification.b) qualitative classification.c) chronological classification.d) geographical classification.Correct answer is option 'A'. Can you explain this answer?

|
Kaavya Mukherjee answered |
Quantitative Classification
Quantitative classification refers to data that is classified according to some characteristics that are capable of direct measurement. This type of classification involves data that can be expressed in numerical terms and is based on quantitative analysis.
Examples of quantitative data include:
- Age
- Height
- Weight
- Income
- Number of products sold
- Number of employees
Advantages of Quantitative Classification:
- Provides precise and accurate information
- Allows for statistical analysis and easy comparison between data sets
- Can be used to make predictions and forecasts
Disadvantages of Quantitative Classification:
- May not provide a complete picture of the data
- Does not capture subjective or qualitative aspects of the data
Conclusion:
Quantitative classification is an important method for organizing and analyzing data. It is particularly useful for data that can be expressed in numerical terms, and provides precise and accurate information for decision-making. However, it is important to also consider qualitative aspects of the data to get a complete picture of the situation.
A self-addressed and stamped envelope should be enclosed with a questionnaire is called- a)offer letter
- b)appointment letter
- c)covering letter
- d)resignation letter
Correct answer is option 'C'. Can you explain this answer?
A self-addressed and stamped envelope should be enclosed with a questionnaire is called
a)
offer letter
b)
appointment letter
c)
covering letter
d)
resignation letter
|
|
Priyanka Khatri answered |
A cover letter accompanies or transmits another document such as a survey questionnaire. Its purpose is to alert the respondent about the questionnaire it accompanies and to provide the details of requested actions on the part of the respondent. A cover letter is a living document that often accompanies a resume.
Length is used to represent the data in a- a)pie chart
- b)line graph
- c)bar diagram.
- d)histogram
Correct answer is option 'C'. Can you explain this answer?
Length is used to represent the data in a
a)
pie chart
b)
line graph
c)
bar diagram.
d)
histogram

|
Pranavi Das answered |
Width and number of the bar are immaterial in case of bar diagrams. Bar diagram shows statistical data in terms of length of the bar.
Chapter doubts & questions for Statistics for Economics - Online MCQ Tests for Humanities 2024 is part of Humanities/Arts exam preparation. The chapters have been prepared according to the Humanities/Arts exam syllabus. The Chapter doubts & questions, notes, tests & MCQs are made for Humanities/Arts 2024 Exam. Find important definitions, questions, notes, meanings, examples, exercises, MCQs and online tests here.
Chapter doubts & questions of Statistics for Economics - Online MCQ Tests for Humanities in English & Hindi are available as part of Humanities/Arts exam.
Download more important topics, notes, lectures and mock test series for Humanities/Arts Exam by signing up for free.
Signup to see your scores go up within 7 days!
Study with 1000+ FREE Docs, Videos & Tests
10M+ students study on EduRev
|
© EduRev
|
Education Revolution
|


Follow Us
|


Signup to see your scores
go up within 7 days!
Access 1000+ FREE Docs, Videos and Tests
Takes less than 10 seconds to signup