


All Exams >
Super TET >
Logical Knowledge for Super TET >
All Questions
All questions of Venn Diagram for Super TET Exam
Directions to Solve.
Study the following figure and answer the questions given below.
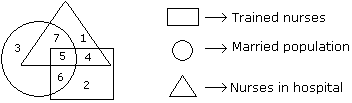 Question: By which number, married but untrained nurses in the hospital are represented?
- a)4
- b)6
- c)7
- d)5
Correct answer is option 'C'. Can you explain this answer?
Directions to Solve.
Study the following figure and answer the questions given below.
Study the following figure and answer the questions given below.
Question: By which number, married but untrained nurses in the hospital are represented?
a)
4
b)
6
c)
7
d)
5

|
Iq Funda answered |
Correct option is C.
The value representing the required qualification should be inside a circle and triangle,but outside square i.e. number 7.
The value representing the required qualification should be inside a circle and triangle,but outside square i.e. number 7.

Directions to SolveIn the following figure small square represents the persons who know English, triangle to those who know Marathi, big square to those who know Telugu and circle to those who know Hindi. In the different regions of the figures from 1 to 12 are given.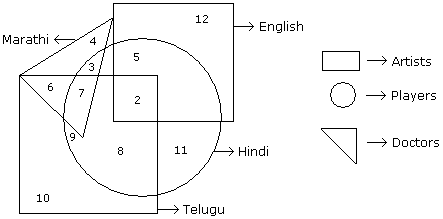 Question - How many persons can speak Marathi and Telugu both ?
- a)10
- b)11
- c)13
- d)None of these
Correct answer is option 'C'. Can you explain this answer?
Directions to Solve
In the following figure small square represents the persons who know English, triangle to those who know Marathi, big square to those who know Telugu and circle to those who know Hindi. In the different regions of the figures from 1 to 12 are given.
Question -
How many persons can speak Marathi and Telugu both ?
a)
10
b)
11
c)
13
d)
None of these
|
|
Iq Funda answered |
Answer: Option C
Explanation:
6 + 7 = 13.
Explanation:
6 + 7 = 13.
Directions to Solve Study the following figure and answer the questions given below. Question - If hospital management requires only married trained nurses for operation theater, which part of diagram should be chosen by him ?- a)7
- b)4
- c)5
- d)6
Correct answer is option 'C'. Can you explain this answer?
Directions to Solve
Study the following figure and answer the questions given below.
If hospital management requires only married trained nurses for operation theater, which part of diagram should be chosen by him ?
a)
7
b)
4
c)
5
d)
6
|
|
Kiran Reddy answered |
because the question is only married trained nurses, so the diagram circle, triangle (represents nurses in hospital) and rectangle where intersect is the married trained nurses to the hospital. So the answer is 5 only.
Each of these questions given below contains three elements. These elements may or may not have some inter linkage. Each group of elements may fit into one of these diagrams at (A), (B), (C), (D) and/or (E). You have to indicate the group of elements which correctly fits into the diagrams. Question - Which of the following diagrams indicates the best relation between Elephant, Carnivorous and Tiger ?- a)

- b)

- c)

- d)

Correct answer is option 'D'. Can you explain this answer?
Each of these questions given below contains three elements. These elements may or may not have some inter linkage. Each group of elements may fit into one of these diagrams at (A), (B), (C), (D) and/or (E). You have to indicate the group of elements which correctly fits into the diagrams.
Question - Which of the following diagrams indicates the best relation between Elephant, Carnivorous and Tiger ?
a)
b)
c)
d)

|
Nidhi Rane answered |
Tiger is carnivorous but Elephant is different from these two.
Directions to Solve Study the following figure and answer the questions given below. Question - By which numbers trained nurses are represented ?- a)3, 6
- b)7, 5
- c)5, 6
- d)1, 5
Correct answer is option 'C'. Can you explain this answer?
Directions to Solve
Study the following figure and answer the questions given below.
By which numbers trained nurses are represented ?
a)
3, 6
b)
7, 5
c)
5, 6
d)
1, 5
|
|
Kiran Reddy answered |
Option A = 3, 6 ; Here 3 is 'just only a married population'.
Option B = 7, 5 ; Here 7 is 'married nurses in hospital but not trained'.
Option D = 1, 1 ; Here 1 is 'nurses in hospital but not trained'.
Option B = 7, 5 ; Here 7 is 'married nurses in hospital but not trained'.
Option D = 1, 1 ; Here 1 is 'nurses in hospital but not trained'.
But, Option C = 5, 6 ; Here both 5 & 6 are covered with 'Trained nurses'. Hence the required answers.
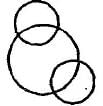
Which of the following diagrams indicates the best relation between Moon, Sun and Earth ?- a)

- b)

- c)

- d)

Correct answer is option 'C'. Can you explain this answer?
Which of the following diagrams indicates the best relation between Moon, Sun and Earth ?
a)
b)
c)
d)
|
|
Mira Chopra answered |
All the three are different from each other.
Which of the following diagrams indicates the best relation between Examination, Questions and Practice ?- a)

- b)

- c)

- d)

Correct answer is option 'C'. Can you explain this answer?
Which of the following diagrams indicates the best relation between Examination, Questions and Practice ?
a)
b)
c)
d)

|
Raghavendra Sharma answered |
Some questions are asked in examination and some in practice but examination and practice are different from each other.
Which of the following diagrams indicates the best relation between Iron, Lead and Nitrogen ?- a)

- b)

- c)

- d)

Correct answer is option 'B'. Can you explain this answer?
Which of the following diagrams indicates the best relation between Iron, Lead and Nitrogen ?
a)
b)
c)
d)

|
Ishani Rane answered |
All these three elements are different from each other
Each of these questions given below contains three elements. These elements may or may not have some inter linkage. Each group of elements may fit into one of these diagrams at (A), (B), (C), (D) and/or (E). You have to indicate the group of elements which correctly fits into the diagrams.Q.Which of the following diagrams indicates the best relation between Travelers, Train and Bus ?- a)

- b)

- c)

- d)

Correct answer is option 'C'. Can you explain this answer?
Each of these questions given below contains three elements. These elements may or may not have some inter linkage. Each group of elements may fit into one of these diagrams at (A), (B), (C), (D) and/or (E). You have to indicate the group of elements which correctly fits into the diagrams.
Q.
Which of the following diagrams indicates the best relation between Travelers, Train and Bus ?
a)
b)
c)
d)
|
|
Iq Funda answered |
The best relation between Travelers, Train, and Bus can be represented in a Venn diagram, where Travelers are represented as a larger circle containing both Train and Bus circles. This is because travelers can choose either train or bus as their mode of transportation, and some may use both. Here's the explanation:
Travelers
- Travelers are people who move from one place to another for various reasons, such as work, leisure, or other purposes.
Train
- A train is a mode of transportation that runs on a railway track and can carry passengers or goods.
- Some travelers may choose to travel by train due to various factors such as cost, comfort, or availability.
Bus
- A bus is a mode of transportation that runs on roads and can carry passengers.
- Some travelers may choose to travel by bus due to factors such as cost, convenience, or accessibility.
Venn Diagram: Option C
- In option C, we have a large circle representing Travelers, which includes two smaller circles representing Train and Bus.
- This diagram shows that there are travelers who use trains, travelers who use buses, and some travelers who may use both modes of transportation.
- This representation captures the relationship between travelers and their choice of transportation, whether it's by train, bus, or both.
Which of the following diagrams indicates the best relation between Lion, Dog and Snake ?- a)

- b)

- c)

- d)

Correct answer is option 'C'. Can you explain this answer?
Which of the following diagrams indicates the best relation between Lion, Dog and Snake ?
a)
b)
c)
d)
|
|
Sinjini Dasgupta answered |
All the three are different from each other.
Directions to Solve Each of these questions given below contains three elements. These elements may or may not have some inter linkage. Each group of elements may fit into one of these diagrams at (A), (B), (C), (D) and/or (E). You have to indicate the group of elements which correctly fits into the diagrams. Question - Which of the following diagrams indicates the best relation between Hospital, Nurse and Patient ?- a)

- b)

- c)

- d)

Correct answer is option 'C'. Can you explain this answer?
Directions to Solve
Each of these questions given below contains three elements. These elements may or may not have some inter linkage. Each group of elements may fit into one of these diagrams at (A), (B), (C), (D) and/or (E). You have to indicate the group of elements which correctly fits into the diagrams.
Question - Which of the following diagrams indicates the best relation between Hospital, Nurse and Patient ?
a)
b)
c)
d)

|
Kirti Yadav answered |
Hospital consists of nurse and patient but nurse and patient are of two different nature.
Directions to Solve Each of these questions given below contains three elements. These elements may or may not have some inter linkage. Each group of elements may fit into one of these diagrams at (A), (B), (C), (D) and/or (E). You have to indicate the group of elements which correctly fits into the diagrams. Question - Which of the following diagrams indicates the best relation between Ass, Pet and Horse ?- a)

- b)

- c)

- d)

Correct answer is option 'D'. Can you explain this answer?
Directions to Solve
Each of these questions given below contains three elements. These elements may or may not have some inter linkage. Each group of elements may fit into one of these diagrams at (A), (B), (C), (D) and/or (E). You have to indicate the group of elements which correctly fits into the diagrams.
Question - Which of the following diagrams indicates the best relation between Ass, Pet and Horse ?
a)
b)
c)
d)

|
Chirag Basu answered |
Ass and Horse are different from each other but both are pet.
In the given figure if Triangle represents healthy people, Square represents old persons and Circle represents men then What is the number of those men who are healthy but not old ?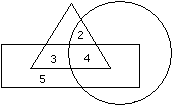
- a)3
- b)4
- c)6
- d)2
Correct answer is option 'D'. Can you explain this answer?
In the given figure if Triangle represents healthy people, Square represents old persons and Circle represents men then What is the number of those men who are healthy but not old ?
a)
3
b)
4
c)
6
d)
2

|
Bank Exams India answered |
Correct option is D)
No answer description available for this question.
Directions to Solve Each of these questions given below contains three elements. These elements may or may not have some inter linkage. Each group of elements may fit into one of these diagrams at (A), (B), (C), (D) and/or (E). You have to indicate the group of elements which correctly fits into the diagrams. Question - Which of the following diagrams indicates the best relation between Judge, Thieves and Criminals ?- a)

- b)

- c)

- d)

Correct answer is option 'B'. Can you explain this answer?
Directions to Solve
Each of these questions given below contains three elements. These elements may or may not have some inter linkage. Each group of elements may fit into one of these diagrams at (A), (B), (C), (D) and/or (E). You have to indicate the group of elements which correctly fits into the diagrams.
Question - Which of the following diagrams indicates the best relation between Judge, Thieves and Criminals ?
a)
b)
c)
d)

|
Avi Chakraborty answered |
All the thieves are criminals while judge is different from these.
Which of the following diagrams indicates the best relation between Bulb, Lamp and Light ?- a)

- b)

- c)

- d)

Correct answer is option 'C'. Can you explain this answer?
Which of the following diagrams indicates the best relation between Bulb, Lamp and Light ?
a)
b)
c)
d)

|
Sameer Rane answered |
Bulb and Lamp are different from each other but light is obtained from both.
Directions to Solve Each of these questions given below contains three elements. These elements may or may not have some inter linkage. Each group of elements may fit into one of these diagrams at (A), (B), (C), (D) and/or (E). You have to indicate the group of elements which correctly fits into the diagrams. Question - Which of the following diagrams indicates the best relation between Vegetables, Tomato and Fruits ?- a)

- b)

- c)

- d)

Correct answer is option 'A'. Can you explain this answer?
Directions to Solve
Each of these questions given below contains three elements. These elements may or may not have some inter linkage. Each group of elements may fit into one of these diagrams at (A), (B), (C), (D) and/or (E). You have to indicate the group of elements which correctly fits into the diagrams.
Question - Which of the following diagrams indicates the best relation between Vegetables, Tomato and Fruits ?
a)
b)
c)
d)
|
|
Nikita Singh answered |
Tomato is a fruit not a vegetable. So vegetable is different.
Each of these questions given below contains three elements. These elements may or may not have some inter linkage. Each group of elements may fit into one of these diagrams at (A), (B), (C), (D) and/or (E). You have to indicate the group of elements which correctly fits into the diagrams. Question - Which of the following diagrams indicates the best relation between Travelers, Train and Bus ?- a)

- b)

- c)

- d)

Correct answer is option 'C'. Can you explain this answer?
Each of these questions given below contains three elements. These elements may or may not have some inter linkage. Each group of elements may fit into one of these diagrams at (A), (B), (C), (D) and/or (E). You have to indicate the group of elements which correctly fits into the diagrams.
Question - Which of the following diagrams indicates the best relation between Travelers, Train and Bus ?
a)
b)
c)
d)
|
|
Ishani Rane answered |
Bus and Train are different from each other but some travelers travel by bus and some travel by train.
Directions to Solve Each of these questions given below contains three elements. These elements may or may not have some inter linkage. Each group of elements may fit into one of these diagrams at (A), (B), (C), (D) and/or (E). You have to indicate the group of elements which correctly fits into the diagrams. Question - Which of the following diagrams indicates the best relation between Profit, Dividend and Bonus ?- a)

- b)

- c)

- d)

Correct answer is option 'B'. Can you explain this answer?
Directions to Solve
Each of these questions given below contains three elements. These elements may or may not have some inter linkage. Each group of elements may fit into one of these diagrams at (A), (B), (C), (D) and/or (E). You have to indicate the group of elements which correctly fits into the diagrams.
Question - Which of the following diagrams indicates the best relation between Profit, Dividend and Bonus ?
a)
b)
c)
d)

|
Niti Iyer answered |
Bonus and Dividend are different from each other. But both these are parts of profit.
Directions to SolveIn the following diagram rectangle represents men, Triangle represents educated, Circle represents urban and square represents government employees.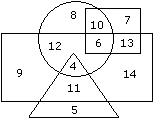 Question - Which one of the following represents the educated men but not urban ?
- a)9
- b)5
- c)4
- d)11
Correct answer is option 'D'. Can you explain this answer?
Directions to Solve
In the following diagram rectangle represents men, Triangle represents educated, Circle represents urban and square represents government employees.
Question -
Which one of the following represents the educated men but not urban ?
a)
9
b)
5
c)
4
d)
11

|
Naroj Boda answered |
The logic follows here is:
Educated men who are not urban means common part of the shapes,i.e, Common part of rectangle and triangle but excluding the circle.
Hence,11 is the correct answer.
Directions to Solve In the following figure small square represents the persons who know English, triangle to those who know Marathi, big square to those who know Telugu and circle to those who know Hindi. In the different regions of the figures from 1 to 12 are given. Question - How many persons can speak English and Hindi both the languages only ?- a)5
- b)8
- c)7
- d)18
Correct answer is option 'A'. Can you explain this answer?
Directions to Solve
In the following figure small square represents the persons who know English, triangle to those who know Marathi, big square to those who know Telugu and circle to those who know Hindi. In the different regions of the figures from 1 to 12 are given.
How many persons can speak English and Hindi both the languages only ?
a)
5
b)
8
c)
7
d)
18

|
Shubham Mittal answered |
5
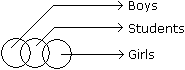
Directions to Solve Each of these questions given below contains three elements. These elements may or may not have some inter linkage. Each group of elements may fit into one of these diagrams at (A), (B), (C), (D) and/or (E). You have to indicate the group of elements which correctly fits into the diagrams. Question - Which of the following diagrams indicates the best relation between Boys, Girls and Students ?- a)

- b)

- c)

- d)

Correct answer is option 'D'. Can you explain this answer?
Directions to Solve
Each of these questions given below contains three elements. These elements may or may not have some inter linkage. Each group of elements may fit into one of these diagrams at (A), (B), (C), (D) and/or (E). You have to indicate the group of elements which correctly fits into the diagrams.
Question - Which of the following diagrams indicates the best relation between Boys, Girls and Students ?
a)
b)
c)
d)

|
Sanjana Tiwari answered |
Each of these questions given below contains three elements. These elements may or may not have some inter linkage. Each group of elements may fit into one of these diagrams at (A), (B), (C), (D) and/or (E). You have to indicate the group of elements which correctly fits into the diagrams. Question - Which of the following diagrams indicates the best relation between Women, Mothers and Engineers ?- a)

- b)

- c)

- d)

Correct answer is option 'A'. Can you explain this answer?
Each of these questions given below contains three elements. These elements may or may not have some inter linkage. Each group of elements may fit into one of these diagrams at (A), (B), (C), (D) and/or (E). You have to indicate the group of elements which correctly fits into the diagrams.
Question - Which of the following diagrams indicates the best relation between Women, Mothers and Engineers ?
a)
b)
c)
d)

|
Partho Nambiar answered |
All mothers are women and some mothers and some women may be engineers.
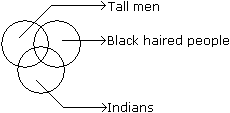
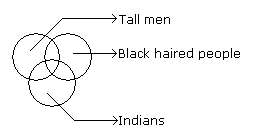
Directions to Solve Each of these questions given below contains three elements. These elements may or may not have some inter linkage. Each group of elements may fit into one of these diagrams at (A), (B), (C), (D) and/or (E). You have to indicate the group of elements which correctly fits into the diagrams. Question - Which of the following diagrams indicates the best relation between Tall man, Black haired people and Indians ?- a)

- b)

- c)

- d)

Correct answer is option 'A'. Can you explain this answer?
Directions to Solve
Each of these questions given below contains three elements. These elements may or may not have some inter linkage. Each group of elements may fit into one of these diagrams at (A), (B), (C), (D) and/or (E). You have to indicate the group of elements which correctly fits into the diagrams.
Question - Which of the following diagrams indicates the best relation between Tall man, Black haired people and Indians ?
a)
b)
c)
d)

|
Nayanika Basu answered |
In the figure given below, square represents doctors, triangle represents ladies and circle represents surgeon. By which letter the ladies who doctor and surgeon both are represented ?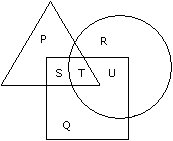
- a)U
- b)T
- c)S
- d)P
Correct answer is option 'B'. Can you explain this answer?
In the figure given below, square represents doctors, triangle represents ladies and circle represents surgeon. By which letter the ladies who doctor and surgeon both are represented ?
a)
U
b)
T
c)
S
d)
P

|
Constructing Careers answered |
Correct option is B)
No answer description available for this question.
There are 3 clubs A, B & C in a town with 40, 50 & 60 members respectively. While 10 people are members of all 3 clubs, 70 are members in only one club. How many belong to exactly two clubs?- a)20
- b)25
- c)50
- d)70
Correct answer is option 'B'. Can you explain this answer?
There are 3 clubs A, B & C in a town with 40, 50 & 60 members respectively. While 10 people are members of all 3 clubs, 70 are members in only one club. How many belong to exactly two clubs?
a)
20
b)
25
c)
50
d)
70

|
G.K Academy answered |
We know that x + y + z = T and x + 2y + 3z = R, where
x = number of members belonging to exactly 1 set = 70
y = number of members belonging to exactly 2 sets
z = number of members belonging to exactly 3 sets = 10
T = Total number of members
R = Repeated total of all the members = (40 + 50 + 60) = 150
Thus we have two equations and two unknowns. Solving this we get y = 25
So, 25 people belong to exactly 2 clubs.


Which of the following diagrams indicates the best relation between Mercury, Zinc and Metal ?- a)

- b)

- c)

- d)

Correct answer is 'B'. Can you explain this answer?
Which of the following diagrams indicates the best relation between Mercury, Zinc and Metal ?
a)
b)
c)
d)
|
|
Sameer Rane answered |
Mercury and Zinc both are different from one another but belong to metal.
Which of the following diagrams indicates the best relation between Teacher, Writer and Musician ?- a)

- b)

- c)

- d)

Correct answer is option 'A'. Can you explain this answer?
Which of the following diagrams indicates the best relation between Teacher, Writer and Musician ?
a)
b)
c)
d)
|
|
Sameer Rane answered |
A teacher may or may not be a writer and musician. Similarly a musician may or may not be a teacher and writer and so a writer may or may not be a teacher and musician.
Directions to Solve Each of these questions given below contains three elements. These elements may or may not have some inter linkage. Each group of elements may fit into one of these diagrams at (A), (B), (C), (D) and/or (E). You have to indicate the group of elements which correctly fits into the diagrams. Question - Which of the following diagrams indicates the best relation between Examination, Questions and Practice ?- a)

- b)

- c)

- d)

Correct answer is option 'C'. Can you explain this answer?
Directions to Solve
Each of these questions given below contains three elements. These elements may or may not have some inter linkage. Each group of elements may fit into one of these diagrams at (A), (B), (C), (D) and/or (E). You have to indicate the group of elements which correctly fits into the diagrams.
Question - Which of the following diagrams indicates the best relation between Examination, Questions and Practice ?
a)
b)
c)
d)
|
|
Harshitha Desai answered |
Some questions are asked in examination and some in practice but examination and practice are different from each other.
In a class of 60, along with English as a common subject, students can opt to major in Mathematics, Physics, Biology or a combination of any two. 6 students major in both Mathematics and Physics, 15 major in both Physics and Biology, but no one majors in both Mathematics and Biology. In an English test, the average mark scored by students majoring in Mathematics is 45 and that of students majoring in Biology is 60. However, the combined average mark in English, of students of these two majors, is 50. What is the maximum possible number of students who major ONLY in Physics?
- a)15
- b)25
- c)20
- d)30
Correct answer is option 'A'. Can you explain this answer?
In a class of 60, along with English as a common subject, students can opt to major in Mathematics, Physics, Biology or a combination of any two. 6 students major in both Mathematics and Physics, 15 major in both Physics and Biology, but no one majors in both Mathematics and Biology. In an English test, the average mark scored by students majoring in Mathematics is 45 and that of students majoring in Biology is 60. However, the combined average mark in English, of students of these two majors, is 50. What is the maximum possible number of students who major ONLY in Physics?
a)
15
b)
25
c)
20
d)
30
|
|
Sanjana Nambiar answered |
Understanding the Problem
To solve the problem, we need to analyze the distribution of students in various majors and how they impact the total count.
Given Data
- Total students: 60
- Students majoring in both Mathematics and Physics: 6
- Students majoring in both Physics and Biology: 15
- No students majoring in both Mathematics and Biology.
Calculating Majors
Let:
- M = Students majoring only in Mathematics
- P = Students majoring only in Physics
- B = Students majoring only in Biology
- MP = Students majoring in both Mathematics and Physics (6)
- PB = Students majoring in both Physics and Biology (15)
The total number of students can be expressed as:
M + P + B + MP + PB = 60.
Substituting the values:
M + P + B + 6 + 15 = 60
M + P + B = 39.
Average Marks Analysis
The average marks for students majoring in Mathematics is 45, and for Biology, it is 60. The combined average for these two groups is 50.
Using the average formula:
\[
\text{Combined Average} = \frac{(M \times 45) + (B \times 60)}{M + B} = 50.
\]
After simplification:
\[
(M \times 45) + (B \times 60) = 50(M + B).
\]
This leads to:
\[
(M \times -5) + (B \times 10) = 0 \Rightarrow 10B = 5M \Rightarrow B = \frac{M}{2}.
\]
Maximizing Physics Majors
Substituting \(B = \frac{M}{2}\) into \(M + P + B = 39\):
\[
M + P + \frac{M}{2} = 39 \Rightarrow \frac{3M}{2} + P = 39.
\]
Assuming \(M + P + 6 + 15 \leq 60\), we want to maximize \(P\).
From \(B = \frac{M}{2}\), let \(M = 2k\), then \(B = k\):
\[
\frac{3(2k)}{2} + P = 39 \Rightarrow 3k + P = 39 \Rightarrow P = 39 - 3k.
\]
To maximize \(P\), minimize \(k\). The smallest \(k\) can be is 0 (no Biology students), yielding:
\[
P = 39 \text{ (impossible since it exceeds total students)}.
\]
Testing \(k = 1\):
\[
P = 39 - 3(1) = 36 \text{ (still exceeds total)}.
\]
Continuing, when \(k=3\):
\[
P = 39 - 9 = 30 \text{ (valid)}.
\]
Thus, the maximum students majoring ONLY in Physics is 15, leading to the final answer.
Conclusion
The maximum possible number of students majoring ONLY in Physics is:
Answer: 15
In a certain village, 22% of the families own agricultural land, 18% own a mobile phone and 1600 families own both agricultural land and a mobile phone. If 68% of the families neither own agricultural land nor a mobile phone, then the total number of families living in the village is:- a)20000
- b)10000
- c)8000
- d)5000
Correct answer is option 'A'. Can you explain this answer?
In a certain village, 22% of the families own agricultural land, 18% own a mobile phone and 1600 families own both agricultural land and a mobile phone. If 68% of the families neither own agricultural land nor a mobile phone, then the total number of families living in the village is:
a)
20000
b)
10000
c)
8000
d)
5000

|
Aim It Academy answered |
Let total number of families in the village be T
Number of families own agricultural land, n(A) = 0.22T
Number of families own agricultural land, n(A) = 0.22T
Number of families own mobile phone, n(M) = 0.18T
Number of families own both agricultural land and mobile phone, n(A ⋂ M) = 1600
Number of families own agricultural land or mobile phone, n(A ⋃ M) = T – 0.68T = 0.32T
∴ n(A ⋃ M) = n(A) + n(M) – n(A ⋂ M)
∴ n(A ⋂ M) = 0.08T
0.08T = 1600 ⇒ T = 20000
Hence, option (a).
400 students were admitted to the 2018-19 MBA batch. 200 of them did not choose “Business Statistics”. 100 of them did not choose “International Management’. There were 80 students who did not choose any of the two subjects. Find the number of students who chose both Business Statistics and International Management.- a)220
- b)180
- c)280
- d)300
Correct answer is option 'B'. Can you explain this answer?
400 students were admitted to the 2018-19 MBA batch. 200 of them did not choose “Business Statistics”. 100 of them did not choose “International Management’. There were 80 students who did not choose any of the two subjects. Find the number of students who chose both Business Statistics and International Management.
a)
220
b)
180
c)
280
d)
300
|
|
Maitri Sengupta answered |
Given Information:
- Total number of students admitted to the 2018-19 MBA batch = 400
- Number of students who did not choose "Business Statistics" = 200
- Number of students who did not choose "International Management" = 100
- Number of students who did not choose either subject = 80
Calculations:
Let's denote:
- Number of students who chose both "Business Statistics" and "International Management" as x
- Number of students who chose only "Business Statistics" as y
- Number of students who chose only "International Management" as z
From the given information, we can create the following equations:
x + y = 200 (Total number of students who chose "Business Statistics")
x + z = 100 (Total number of students who chose "International Management")
x + y + z + 80 = 400 (Total number of students admitted)
Now, we can solve these equations to find the values of x, y, and z.
From the first two equations:
y = 200 - x
z = 100 - x
Substitute these values in the third equation:
x + (200 - x) + (100 - x) + 80 = 400
300 - x + 80 = 400
380 - x = 400
-x = 20
x = 20
Therefore, the number of students who chose both "Business Statistics" and "International Management" is 20.
Therefore, the correct answer is option B) 180.
Out of 60 families living in a building, all those families which own a car own a scooter as well. No family has just a scooter and a bike. 16 families have both a car and a bike. Every family owns at least one type of vehicle and the number of families that own exactly one type of vehicle is more than the number of families that own more than one type of vehicle. What is the sum of the maximum and minimum number of families that own only a bike?- a)24
- b)34
- c)54
- d)44
Correct answer is option 'D'. Can you explain this answer?
Out of 60 families living in a building, all those families which own a car own a scooter as well. No family has just a scooter and a bike. 16 families have both a car and a bike. Every family owns at least one type of vehicle and the number of families that own exactly one type of vehicle is more than the number of families that own more than one type of vehicle. What is the sum of the maximum and minimum number of families that own only a bike?
a)
24
b)
34
c)
54
d)
44

|
Learning Education answered |
From the information given in the question, the following Venn Diagram can be constructed:
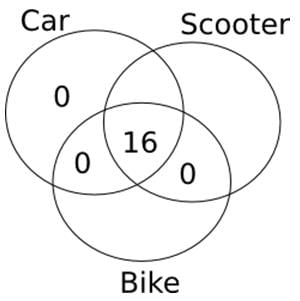
So, in order to maximize the number of families that own only a bike, we can put the remaining 44 families in ‘only bike’ region.
So, in order to maximize the number of families that own only a bike, we can put the remaining 44 families in ‘only bike’ region.
Similarly, in order to minimize the number of families that own only a bike, we can put the remaining 44 families in ‘only scooter’ region.
So, the maximum number of families that own only a bike is 44 and the minimum number of families that own only a bike is 0.
So, sum = 44 + 0 = 44
Each of these questions given below contains three elements. These elements may or may not have some inter linkage. Each group of elements may fit into one of these diagrams at (A), (B), (C), (D) and/or (E). You have to indicate the group of elements which correctly fits into the diagrams. Question - Which of the following diagrams indicates the best relation between Factory, Product and Machinery ?- a)

- b)

- c)

- d)

Correct answer is option 'D'. Can you explain this answer?
Each of these questions given below contains three elements. These elements may or may not have some inter linkage. Each group of elements may fit into one of these diagrams at (A), (B), (C), (D) and/or (E). You have to indicate the group of elements which correctly fits into the diagrams.
Question - Which of the following diagrams indicates the best relation between Factory, Product and Machinery ?
a)
b)
c)
d)
|
|
Nikita Singh answered |
Product and Machinery are different from each other but both are found in Factory.
A premier B-school, which is in process of getting an AACSB accreditation, has 360 second year students. To incorporate sustainability into their curriculum, it has offered 3 new elective subjects in the second year namely Green Supply Chain, Global Climate Change & Business and Corporate Governance. Twelve students have taken all the three electives, and 120 students study Green Supply Chain. There are twice as many students who study Green Supply Chain and Corporate Governance but not Global Climate Change and Business, as those who study both Green Supply Chain and Global Climate Change & Business but not Corporate Governance, and 4 times as many who study all the three. 124 students study Corporate Governance. There are 72 students who could not muster up the courage to take up any of these subjects. The group of students who study both Green Supply Chain and Corporate Governance but not global Climate Change & Business is exactly the same as the group made up to the students who study both Global Climate Change & Business and Corporate Governance. How many students study Global Climate Change & Business only?- a)176
- b)104
- c)152
- d)188
Correct answer is option 'B'. Can you explain this answer?
A premier B-school, which is in process of getting an AACSB accreditation, has 360 second year students. To incorporate sustainability into their curriculum, it has offered 3 new elective subjects in the second year namely Green Supply Chain, Global Climate Change & Business and Corporate Governance. Twelve students have taken all the three electives, and 120 students study Green Supply Chain. There are twice as many students who study Green Supply Chain and Corporate Governance but not Global Climate Change and Business, as those who study both Green Supply Chain and Global Climate Change & Business but not Corporate Governance, and 4 times as many who study all the three. 124 students study Corporate Governance. There are 72 students who could not muster up the courage to take up any of these subjects. The group of students who study both Green Supply Chain and Corporate Governance but not global Climate Change & Business is exactly the same as the group made up to the students who study both Global Climate Change & Business and Corporate Governance. How many students study Global Climate Change & Business only?
a)
176
b)
104
c)
152
d)
188
|
|
Rithika Chakraborty answered |
Understanding the Problem
To solve the problem, we need to set up variables for the number of students in each category of elective subjects.
Given Data
- Total students = 360
- Students not taking any subject = 72
- Students taking Green Supply Chain (G) = 120
- Students taking Corporate Governance (C) = 124
- Students taking all three subjects = 12
- Let:
- x = Students taking G and C but not Global Climate Change (X)
- y = Students taking G and X but not C
- z = Students taking X and C but not G
Relationships between the groups
- According to the problem:
- \( x = 2y \)
- \( x = z \)
- \( y = 12 \) (since 12 students take all three subjects)
Calculating Students in Each Category
Using the relationships:
- \( y = 12 \) (students taking all three)
- \( x = 2y = 2 \times 12 = 24 \)
- \( z = x = 24 \)
Calculating Total Students Taking Each Subject
Using the inclusion-exclusion principle:
- Total taking G and C = \( 120 + 124 - (x + y + z + 12) \)
Set the equation:
- \( 120 + 124 - (24 + 12 + 24 + 12) = 360 - 72 \)
- Solve for students taking Global Climate Change only:
Final Calculation
Total students studying:
- \( G + C + X - G \cap C - G \cap X - C \cap X + G \cap C \cap X = 288 \)
Thus, the students studying Global Climate Change only = \( 360 - 72 - (students in G + C + both) = 104 \).
Conclusion
The number of students studying Global Climate Change & Business only is:
Answer: 104 (Option B).
In an amusement park along with the entry pass a visitor gets two of the three available rides (A, B and C) free. On a particular day 77 opted for ride A, 55 opted for B and 50 opted for C; 25 visitors opted for both A and C, 22 opted for both A and B, while no visitor opted for both B and C. 40 visitors did not opt for ride A and B, or both. How many visited with the entry pass on that day?- a)102
- b)115
- c)130
- d)150
Correct answer is option 'D'. Can you explain this answer?
In an amusement park along with the entry pass a visitor gets two of the three available rides (A, B and C) free. On a particular day 77 opted for ride A, 55 opted for B and 50 opted for C; 25 visitors opted for both A and C, 22 opted for both A and B, while no visitor opted for both B and C. 40 visitors did not opt for ride A and B, or both. How many visited with the entry pass on that day?
a)
102
b)
115
c)
130
d)
150

|
Ankit Jain answered |
To solve this problem, we can use the principle of inclusion-exclusion. We will start by finding the total number of visitors who opted for at least one of the rides.
Step 1: Find the total number of visitors who opted for at least one of the rides.
Let's denote the number of visitors who opted for ride A as A, for ride B as B, and for ride C as C. We are given the following information:
A = 77 (opted for ride A)
B = 55 (opted for ride B)
C = 50 (opted for ride C)
A ∩ C = 25 (opted for both A and C)
A ∩ B = 22 (opted for both A and B)
Using these values, we can find the total number of visitors who opted for at least one of the rides:
Total = A + B + C - (A ∩ C) - (A ∩ B) + (Neither A nor B nor C)
Total = 77 + 55 + 50 - 25 - 22 + 40
Total = 175
So, the total number of visitors who opted for at least one of the rides is 175.
Step 2: Find the number of visitors who did not opt for any ride.
From the given information, we know that 40 visitors did not opt for ride A and B, or both. Let's denote the number of visitors who did not opt for any ride as N.
N = 40
Step 3: Find the number of visitors who visited with the entry pass.
The number of visitors who visited with the entry pass is the total number of visitors minus the number of visitors who did not opt for any ride.
Visitors with entry pass = Total - N
Visitors with entry pass = 175 - 40
Visitors with entry pass = 135
Therefore, the correct answer is option D) 150.
Directions to Solve Each of these questions given below contains three elements. These elements may or may not have some inter linkage. Each group of elements may fit into one of these diagrams at (A), (B), (C), (D) and/or (E). You have to indicate the group of elements which correctly fits into the diagrams. Question - Which of the following diagrams indicates the best relation between Page, Chapter and Book ?- a)

- b)

- c)

- d)

Correct answer is option 'D'. Can you explain this answer?
Directions to Solve
Each of these questions given below contains three elements. These elements may or may not have some inter linkage. Each group of elements may fit into one of these diagrams at (A), (B), (C), (D) and/or (E). You have to indicate the group of elements which correctly fits into the diagrams.
Question - Which of the following diagrams indicates the best relation between Page, Chapter and Book ?
a)
b)
c)
d)

|
Lakshmi Dasgupta answered |
Page is in Chapter and Chapter is in book.
Directions to SolveStudy the following figure and answer the questions given below.Question - What is represented by the number 7 ?- a)Married nurses in the hospital
- b)Trained nurses
- c)Unmarried trained nurses
- d)Married trained nurses
Correct answer is option 'A'. Can you explain this answer?
Directions to Solve
Study the following figure and answer the questions given below.
Question -
What is represented by the number 7 ?
a)
Married nurses in the hospital
b)
Trained nurses
c)
Unmarried trained nurses
d)
Married trained nurses
|
|
Vikram Mehta answered |
Answer: Option A
Explanation:
- As triangle represents the nurses in hospital.
- And circle represents the married population.
- 7 is in intersecting point of circle and triangle
- So, No 7 repersents mazrried nurses in the hospital.
Shyam visited Ram during his brief vacation. In the mornings they both would go for yoga. In the evenings they would play tennis. To have more fun, they indulge only in one activity per day, i.e. either they went for yoga or played tennis each day. There were days when they were lazy and stayed home all day long. There were 24 mornings when they did nothing, 14 evenings when they stayed at home, and a total of 22 days when they did yoga or played tennis. For how many days Shyam stayed with Ram?- a)32
- b)24
- c)30
- d)None of these
Correct answer is option 'C'. Can you explain this answer?
Shyam visited Ram during his brief vacation. In the mornings they both would go for yoga. In the evenings they would play tennis. To have more fun, they indulge only in one activity per day, i.e. either they went for yoga or played tennis each day. There were days when they were lazy and stayed home all day long. There were 24 mornings when they did nothing, 14 evenings when they stayed at home, and a total of 22 days when they did yoga or played tennis. For how many days Shyam stayed with Ram?
a)
32
b)
24
c)
30
d)
None of these
|
|
Learning Education answered |
Let the number of days in the vacation be x
They played tennis for x - 14 days
They did yoga for x - 24 days
So, they did yoga or played tennis for x - 14 + x - 24 = 2x - 38 days
2x – 38 = 22
=> x = 30
They played tennis for x - 14 days
They did yoga for x - 24 days
So, they did yoga or played tennis for x - 14 + x - 24 = 2x - 38 days
2x – 38 = 22
=> x = 30
Directions to Solve In the following figure small square represents the persons who know English, triangle to those who know Marathi, big square to those who know Telugu and circle to those who know Hindi. In the different regions of the figures from 1 to 12 are given. Question - How many persons can speak all the languages ?- a)1
- b)8
- c)2
- d)None
Correct answer is option 'D'. Can you explain this answer?
Directions to Solve
In the following figure small square represents the persons who know English, triangle to those who know Marathi, big square to those who know Telugu and circle to those who know Hindi. In the different regions of the figures from 1 to 12 are given.
How many persons can speak all the languages ?
a)
1
b)
8
c)
2
d)
None

|
Pritam Nair answered |
There is no such person who can speak all the languages.
Directions to Solve Each of these questions given below contains three elements. These elements may or may not have some inter linkage. Each group of elements may fit into one of these diagrams at (A), (B), (C), (D) and/or (E). You have to indicate the group of elements which correctly fits into the diagrams. Question - Which of the following diagrams indicates the best relation between Men, Rodents and Living beings ?- a)

- b)

- c)

- d)

Correct answer is option 'C'. Can you explain this answer?
Directions to Solve
Each of these questions given below contains three elements. These elements may or may not have some inter linkage. Each group of elements may fit into one of these diagrams at (A), (B), (C), (D) and/or (E). You have to indicate the group of elements which correctly fits into the diagrams.
Question - Which of the following diagrams indicates the best relation between Men, Rodents and Living beings ?
a)
b)
c)
d)

|
Arnav Rane answered |
Men and Rodents are different from one another but both these belong to living beings.
The diagram given below represents those students who play Cricket, Football and Kabaddi.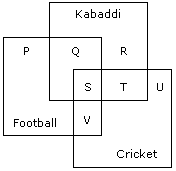 Study the diagram and identify the students who play all the three games.
- a)P + Q + R
- b)V + T
- c)S + T + V
- d)S
Correct answer is option 'D'. Can you explain this answer?
The diagram given below represents those students who play Cricket, Football and Kabaddi.
Study the diagram and identify the students who play all the three games.
a)
P + Q + R
b)
V + T
c)
S + T + V
d)
S

|
Priyanka Datta answered |
S indicates those students who play all three games.
The question below contains three elements. Each group of the elements may fit in to one of the diagrams at (A), (B),(C),(D).. Indicate the group of elements fits into which of the diagrams given below.
Mountains, Forests, Earth
- a)

- b)

- c)

- d)
Correct answer is option 'C'. Can you explain this answer?
The question below contains three elements. Each group of the elements may fit in to one of the diagrams at (A), (B),(C),(D).. Indicate the group of elements fits into which of the diagrams given below.
Mountains, Forests, Earth
Mountains, Forests, Earth
a)
b)
c)
d)
|
|
Mira Sharma answered |
Mountains and Forests are a part of Earth. Some mountains are forests and some forests are mountains. Hence, there representation is as shown in (C).
Correct option is C.
Correct option is C.
Directions to Solve Study the diagram given below and answer each of the following questions.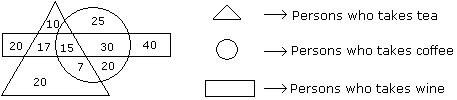 Question - How many persons who take tea and wine but not coffee ?
- a)20
- b)17
- c)25
- d)15
Correct answer is option 'B'. Can you explain this answer?
Directions to Solve
Study the diagram given below and answer each of the following questions.
How many persons who take tea and wine but not coffee ?
a)
20
b)
17
c)
25
d)
15

|
Sanjana Choudhary answered |
17 persons take tea and wine but not coffee.
Directions to Solve In the following figure small square represents the persons who know English, triangle to those who know Marathi, big square to those who know Telugu and circle to those who know Hindi. In the different regions of the figures from 1 to 12 are given. Question - How many persons can speak English, Hindi and Telugu ?- a)8
- b)2
- c)7
- d)None of these
Correct answer is option 'B'. Can you explain this answer?
Directions to Solve
In the following figure small square represents the persons who know English, triangle to those who know Marathi, big square to those who know Telugu and circle to those who know Hindi. In the different regions of the figures from 1 to 12 are given.
How many persons can speak English, Hindi and Telugu ?
a)
8
b)
2
c)
7
d)
None of these

|
Shail Jain answered |
Number of persons who can speak English, Hindi and Telugu is 2.
In the following figure triangle represents 'girls', square players and circle-coach. Which part of the diagram represents the girls who are player but not coach?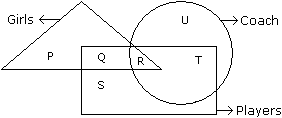
- a)P
- b)Q
- c)R
- d)S
Correct answer is option 'B'. Can you explain this answer?
In the following figure triangle represents 'girls', square players and circle-coach. Which part of the diagram represents the girls who are player but not coach?
a)
P
b)
Q
c)
R
d)
S

|
Alok Patel answered |
Q part of the figure represents those girls who are players but not coach.
Directions to Solve Each of these questions given below contains three elements. These elements may or may not have some inter linkage. Each group of elements may fit into one of these diagrams at (A), (B), (C), (D) and/or (E). You have to indicate the group of elements which correctly fits into the diagrams. Question - Which of the following diagrams indicates the best relation between Class, Blackboard and School ?- a)

- b)

- c)

- d)

Correct answer is option 'C'. Can you explain this answer?
Directions to Solve
Each of these questions given below contains three elements. These elements may or may not have some inter linkage. Each group of elements may fit into one of these diagrams at (A), (B), (C), (D) and/or (E). You have to indicate the group of elements which correctly fits into the diagrams.
Question - Which of the following diagrams indicates the best relation between Class, Blackboard and School ?
a)
b)
c)
d)

|
Dishani Banerjee answered |
Blackboard is in class and class is in the school.
Directions to Solve Each of these questions given below contains three elements. These elements may or may not have some inter linkage. Each group of elements may fit into one of these diagrams at (A), (B), (C), (D) and/or (E). You have to indicate the group of elements which correctly fits into the diagrams. Question - Which of the following diagrams indicates the best relation between Teacher, Writer and Musician ?- a)

- b)

- c)

- d)

Correct answer is option 'A'. Can you explain this answer?
Directions to Solve
Each of these questions given below contains three elements. These elements may or may not have some inter linkage. Each group of elements may fit into one of these diagrams at (A), (B), (C), (D) and/or (E). You have to indicate the group of elements which correctly fits into the diagrams.
Question - Which of the following diagrams indicates the best relation between Teacher, Writer and Musician ?
a)
b)
c)
d)
|
|
Niti Iyer answered |
A teacher may or may not be a writer and musician. Similarly a musician may or may not be a teacher and writer and so a writer may or may not be a teacher and musician.
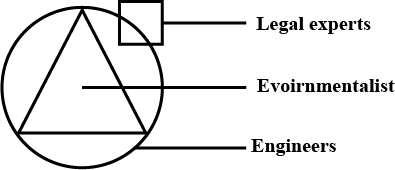
In an organization of pollution control board, engineers are represented by a circle, legal experts by a square and environmentalist by a triangle. Who is most represented in the board as shown in the following figure ?

- a)Environmentalists
- b)Legal Experts
- c)Engineers with legal background
- d)Environmentalists with Engineering background
Correct answer is option 'D'. Can you explain this answer?
In an organization of pollution control board, engineers are represented by a circle, legal experts by a square and environmentalist by a triangle. Who is most represented in the board as shown in the following figure ?
a)
Environmentalists
b)
Legal Experts
c)
Engineers with legal background
d)
Environmentalists with Engineering background

|
Manoj Gupta answered |
Answer is D
Triangle represents both environmentalist who are also engineers.So,most represented in the board is environmentalists with engineering background.
Directions to Solve Each of these questions given below contains three elements. These elements may or may not have some inter linkage. Each group of elements may fit into one of these diagrams at (A), (B), (C), (D) and/or (E). You have to indicate the group of elements which correctly fits into the diagrams. Question - Which of the following diagrams indicates the best relation between Professors, Doctors and Men ?- a)

- b)

- c)

- d)

Correct answer is option 'C'. Can you explain this answer?
Directions to Solve
Each of these questions given below contains three elements. These elements may or may not have some inter linkage. Each group of elements may fit into one of these diagrams at (A), (B), (C), (D) and/or (E). You have to indicate the group of elements which correctly fits into the diagrams.
Question - Which of the following diagrams indicates the best relation between Professors, Doctors and Men ?
a)
b)
c)
d)

|
Simran Roy answered |
Some doctors may be professors and vice-versa.
Some professors may be men and vice-versa.
Some doctors may be men and vice-versa.
Some doctors may be men and professors as well.
Chapter doubts & questions for Venn Diagram - Logical Knowledge for Super TET 2025 is part of Super TET exam preparation. The chapters have been prepared according to the Super TET exam syllabus. The Chapter doubts & questions, notes, tests & MCQs are made for Super TET 2025 Exam. Find important definitions, questions, notes, meanings, examples, exercises, MCQs and online tests here.
Chapter doubts & questions of Venn Diagram - Logical Knowledge for Super TET in English & Hindi are available as part of Super TET exam.
Download more important topics, notes, lectures and mock test series for Super TET Exam by signing up for free.
Logical Knowledge for Super TET
51 videos|41 docs|51 tests
|
|
© EduRev
|
Education Revolution
|


|


Signup to see your scores
go up
within 7 days!
within 7 days!
Takes less than 10 seconds to signup