All Exams >
Year 5 >
Year 5 Mathematics >
All Questions
All questions of Statistics for Year 5 Exam
The median of the data 5, 6, 7, 8, 9, 10 is ______.- a)7
- b)8
- c)7.5
- d)8.5
Correct answer is option 'C'. Can you explain this answer?
The median of the data 5, 6, 7, 8, 9, 10 is ______.
a)
7
b)
8
c)
7.5
d)
8.5
|
|
Seema gupta answered |
Understanding Median
The median is a measure of central tendency that represents the middle value of a dataset when it is arranged in ascending order. Here’s how to find the median for the given data set.
Step 1: Arrange the Data
- The data provided is: 5, 6, 7, 8, 9, 10
- This data is already in ascending order.
Step 2: Identify the Number of Values
- There are 6 values in the dataset.
Step 3: Determine Median Position
- For an even number of observations, the median is calculated by taking the average of the two middle values.
- In this case, the two middle values are the 3rd and 4th values.
Step 4: Find the Middle Values
- The 3rd value is 7.
- The 4th value is 8.
Step 5: Calculate the Median
- To find the median, calculate the average of 7 and 8:
- Median = (7 + 8) / 2 = 15 / 2 = 7.5
Conclusion
- The median of the data set 5, 6, 7, 8, 9, 10 is 7.5.
- Therefore, the correct answer is option 'C'.
This step-by-step approach ensures clarity in understanding how to calculate the median effectively.
The mean of 9 observations is 36. If the mean of the first 5 observations is 32 and that of the last 5 observations is 39, then the fifth observation is _____.- a)28
- b)31
- c)43
- d)37
Correct answer is option 'B'. Can you explain this answer?
The mean of 9 observations is 36. If the mean of the first 5 observations is 32 and that of the last 5 observations is 39, then the fifth observation is _____.
a)
28
b)
31
c)
43
d)
37
|
|
Vivek Bansal answered |
36 x 9 = x1 + x2 + x3 + . . . + x9 ... (i)
5 x 32 = x1 + x2 + x3 + x4 + x5 ,..(ii)
5 x 39 = x5 + x6 + x7 + x8 + x9 ...(iii)
5 x 32 = x1 + x2 + x3 + x4 + x5 ,..(ii)
5 x 39 = x5 + x6 + x7 + x8 + x9 ...(iii)
Adding (ii) and (iii),
we get 355 = x 1 + x2 + x 3 + x4 + x 5 + ... + x9 + X5
Using (i), we get 355 - 36 x 9 = x5
x5 = 31
The mean weight of a class of 34 students is 46.5 kg. If the weight of the teacher is included, the mean rises by 500g. Then the weight of the teacher is _____.- a)175 kg
- b)62 kg
- c)64 kg
- d)72 kg
Correct answer is option 'C'. Can you explain this answer?
The mean weight of a class of 34 students is 46.5 kg. If the weight of the teacher is included, the mean rises by 500g. Then the weight of the teacher is _____.
a)
175 kg
b)
62 kg
c)
64 kg
d)
72 kg

|
Manisha Gupta answered |
Given information:
- Number of students in the class = 34
- Mean weight of the students = 46.5 kg
- Increase in mean weight when teacher's weight is included = 500g
To find:
- Weight of the teacher
Mean weight calculation:
To find the mean weight of the students, we can use the formula:
Mean = Sum of all weights / Number of students
Given that the mean weight of the students is 46.5 kg and there are 34 students, we can write the equation as:
46.5 = Sum of all weights / 34
Total weight of the students:
Sum of all weights = Mean * Number of students
Sum of all weights = 46.5 kg * 34
Sum of all weights = 1581 kg
Weight including the teacher:
When the weight of the teacher is included, the mean weight increases by 500g. Therefore, the new mean weight becomes 46.5 kg + 0.5 kg = 47 kg.
New total weight:
Sum of all weights + Weight of teacher = New mean weight * Total number of students
1581 kg + Weight of teacher = 47 kg * 35 (since the teacher is also included in the count)
1581 kg + Weight of teacher = 1645 kg
Calculating the weight of the teacher:
Weight of teacher = 1645 kg - 1581 kg
Weight of teacher = 64 kg
Therefore, the weight of the teacher is 64 kg, which corresponds to option C.
What is the mean, median, mode of the following data respectively?
0, 2, 2, 3, 3, 3, 4, 5, 5, 5, 5, 6, 6, 7, 8, 8- a)4.5, 5, 5
- b)5, 4, 5
- c)5, 5, 6
- d)4.5, 6, 6
Correct answer is option 'A'. Can you explain this answer?
What is the mean, median, mode of the following data respectively?
0, 2, 2, 3, 3, 3, 4, 5, 5, 5, 5, 6, 6, 7, 8, 8
0, 2, 2, 3, 3, 3, 4, 5, 5, 5, 5, 6, 6, 7, 8, 8
a)
4.5, 5, 5
b)
5, 4, 5
c)
5, 5, 6
d)
4.5, 6, 6
|
|
Rajni das answered |
Mean:
To find the mean, we need to sum up all the numbers in the data set and then divide it by the total number of values.
0 + 2 + 2 + 3 + 3 + 3 + 4 + 5 + 5 + 5 + 5 + 6 + 6 + 7 + 8 + 8 = 86
There are a total of 16 values in the data set, so the mean is 86/16 = 5.375.
Median:
To find the median, we need to arrange the numbers in ascending order and then find the middle value. If there are two middle values, we take the average of those two.
0, 2, 2, 3, 3, 3, 4, 5, 5, 5, 5, 6, 6, 7, 8, 8
Since there are 16 values, the middle two values are the 8th and 9th numbers, which are both 5. Therefore, the median is 5.
Mode:
The mode is the value that appears most frequently in the data set.
In this case, the number 5 appears the most frequently, occurring 4 times. Therefore, the mode is 5.
Summary:
- Mean: 5.375
- Median: 5
- Mode: 5
Therefore, the correct answer is option 'A' - 4.5, 5, 5.
What is the interquartile range for the data 2, 1, 0, 3, 1, 2, 3, 4, 3, 5?- a)1
- b)2
- c)3
- d)4
Correct answer is option 'B'. Can you explain this answer?
What is the interquartile range for the data 2, 1, 0, 3, 1, 2, 3, 4, 3, 5?
a)
1
b)
2
c)
3
d)
4
|
|
Ritu Saxena answered |
The given data in ascending order is 0, 1, 1, 2, 2, 3, 3, 3, 4, 5
n = 10 (even)
Lower quartile = n/4 th = 10/4th = 2.5th
= 3rd term
= 1
n = 10 (even)
Lower quartile = n/4 th = 10/4th = 2.5th
= 3rd term
= 1
If the difference between the mode and median is 2, then the difference between the median and mean is (in the given order).- a)2
- b)4
- c)1
- d)0
Correct answer is option 'C'. Can you explain this answer?
If the difference between the mode and median is 2, then the difference between the median and mean is (in the given order).
a)
2
b)
4
c)
1
d)
0
|
|
Vivek Bansal answered |
Concept: Relation between mode, median and mean is given by:
Mode = 3 × median – 2 × mean
Given: Mode – median = 2
As we know
Mode = 3 × median – 2 × mean
Now, Mode = median + 2
⇒ (2 + median) = 3median – 2mean
⇒ 2Median - 2Mean = 2
⇒ Median - Mean = 1
∴ The difference between the median and mean is 1.
Mode = 3 × median – 2 × mean
Given: Mode – median = 2
As we know
Mode = 3 × median – 2 × mean
Now, Mode = median + 2
⇒ (2 + median) = 3median – 2mean
⇒ 2Median - 2Mean = 2
⇒ Median - Mean = 1
∴ The difference between the median and mean is 1.
If the numbers 25, 31, x -3, 37, x + 4, 42, 43, 45, 46 are in ascending order and their median is 39. What is the number x?- a)40
- b)35
- c)32
- d)42
Correct answer is option 'B'. Can you explain this answer?
If the numbers 25, 31, x -3, 37, x + 4, 42, 43, 45, 46 are in ascending order and their median is 39. What is the number x?
a)
40
b)
35
c)
32
d)
42
|
|
Ritu Saxena answered |
The given data in ascending order is 25, 31, x - 3, 37, x + 4, 42, 43, 45, 46
n = 9 (odd)
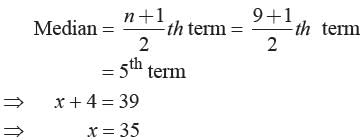
n = 9 (odd)

The median of first 10 Prime numbers is- a)11
- b)12
- c)13
- d)14
Correct answer is option 'B'. Can you explain this answer?
The median of first 10 Prime numbers is
a)
11
b)
12
c)
13
d)
14
|
|
Vivek Bansal answered |
The first 10 Prime numbers are
2, 3, 5, 7, 11, 13, 17, 19, 23, 29
∴ n = 10, which is even
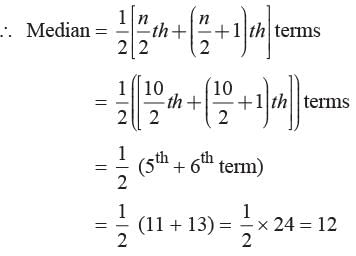
2, 3, 5, 7, 11, 13, 17, 19, 23, 29
∴ n = 10, which is even

T he av er age t em per at ur e of t he t own in the first four days of a month was 58 degree. The average for the second, third, fourth and fifth days was 60 degree. If the temperatures of the first and fifth days were in the ratio 7 : 8, then what is the temperature on the fifth day?- a)64 degree
- b)62 degree
- c)56 degree
- d)None of these
Correct answer is option 'A'. Can you explain this answer?
T he av er age t em per at ur e of t he t own in the first four days of a month was 58 degree. The average for the second, third, fourth and fifth days was 60 degree. If the temperatures of the first and fifth days were in the ratio 7 : 8, then what is the temperature on the fifth day?
a)
64 degree
b)
62 degree
c)
56 degree
d)
None of these
|
|
Ritu Saxena answered |
Let the temperatures on first, second, third, fourth and fifth day be x1, x2, x3, x4 and x5, respectively.
Sum of temperatures of Ifirst four days = 58 * 4
Sum of temperatures of Ifirst four days = 58 * 4
i.e ., x1 + x2 + x3 + x4 = 232 ...(i)
and sum of temperatures on second, third, fourth and fifth day = 60 x 4
i.e., x2 + x3 + x4 + x5- = 240 ...(ii) Subtracting (i) from (ii), we get x5- x1 = 8 ...(iii)
Also, temperature of first and fifth day were in the ratio 7 : 8. Let the temperatures be 7 k and 8k respectively.
From (iii), we have 8k - 7k = 8
From (iii), we have 8k - 7k = 8
⇒ k = 8
Temperature of fifth day = 8 x 8 = 64 degree.
The mean of six numbers is 21. If one number is excluded, then their mean is 19, the excluded number is ______.- a)31
- b)26
- c)28
- d)25
Correct answer is option 'A'. Can you explain this answer?
The mean of six numbers is 21. If one number is excluded, then their mean is 19, the excluded number is ______.
a)
31
b)
26
c)
28
d)
25
|
|
Ritu Saxena answered |
Let the excluded num ber be x and the sum o f rest of numbers be y.
Then, 

⇒ 126 = x + y
Also, 19 = y/5
⇒ y = 95
∴ From (i), x = 31.
If a mode exceeds a mean by 12 then the mode exceeds the median by .- a)4
- b)8
- c)6
- d)10
Correct answer is option 'B'. Can you explain this answer?
If a mode exceeds a mean by 12 then the mode exceeds the median by .
a)
4
b)
8
c)
6
d)
10
|
|
Anjali kumar answered |
Given:
- Mode exceeds the mean by 12.
- Mode exceeds the median.
To Find:
The difference between the mode and the median.
Solution:
Let's consider a set of numbers to understand this concept better. Suppose we have the following set of numbers:
{2, 4, 4, 6, 8, 10, 10, 14}
In this set, the mode is 4 as it appears twice, while other numbers appear only once. The median is 6, which is the middle number when the set is arranged in ascending order.
Now, let's calculate the mean of this set:
Mean = (2 + 4 + 4 + 6 + 8 + 10 + 10 + 14) / 8
= 58 / 8
= 7.25
The mode exceeds the mean by 12, so the mode in this case would be 7.25 + 12 = 19.25.
Now, let's compare the mode and median:
Mode - Median = 19.25 - 6 = 13.25
Conclusion:
In the given scenario, the mode exceeds the median by 13.25. However, none of the options provided matches this value. Therefore, the correct answer cannot be determined from the given options.
The arithmetic mean of a data is 48 and mode is 24 then the median is- a)40
- b)20
- c)42
- d)50
Correct answer is option 'A'. Can you explain this answer?
The arithmetic mean of a data is 48 and mode is 24 then the median is
a)
40
b)
20
c)
42
d)
50

|
Isha Dasgupta answered |
Calculation of Median:
To find the median of the data, we need to arrange the data in ascending order. Since the mode is 24, we know that 24 occurs most frequently in the data set.
Arranged Data:
Let's assume the data set is {24, 24, 30, 40, 50, 60}. The mode is 24 as it appears most frequently.
Finding Median:
Since the data is arranged in ascending order, the median will be the middle value. In this case, the median is 40, which is the value that separates the higher half from the lower half of the data.
Therefore, the correct answer is option A) 40.
The number of problems worked out by a student on seven days of a week are 5, 9, 15, 11, 13, 17, 7, then what is the sum of lower quartile and upper quartile?- a)15
- b)18
- c)22
- d)19
Correct answer is option 'C'. Can you explain this answer?
The number of problems worked out by a student on seven days of a week are 5, 9, 15, 11, 13, 17, 7, then what is the sum of lower quartile and upper quartile?
a)
15
b)
18
c)
22
d)
19
|
|
Ankit reddy answered |
To find the sum of the lower quartile and upper quartile, we first need to arrange the given data in ascending order.
The given data is: 5, 9, 15, 11, 13, 17, 7
Arranging the data in ascending order: 5, 7, 9, 11, 13, 15, 17
Finding the Quartiles:
Quartiles divide the data into four equal parts. The lower quartile (Q1) is the median of the lower half of the data, and the upper quartile (Q3) is the median of the upper half of the data.
Step 1: Find the Median (Q2)
Since there are 7 data points, the median will be the 4th value. In this case, the median (Q2) is 11.
Step 2: Find the Lower Quartile (Q1)
The lower quartile (Q1) is the median of the lower half of the data. In this case, the lower half of the data is 5, 7, and 9. Since there are 3 data points, the median will be the 2nd value, which is 7.
Step 3: Find the Upper Quartile (Q3)
The upper quartile (Q3) is the median of the upper half of the data. In this case, the upper half of the data is 13, 15, and 17. Since there are 3 data points, the median will be the 2nd value, which is 15.
Calculating the sum of the lower quartile and upper quartile:
Q1 + Q3 = 7 + 15 = 22
Therefore, the sum of the lower quartile and upper quartile is 22.
Hence, the correct answer is option C) 22.
The mode of the data 6, 4, 3, 6, 4, 3, 4, 6, 5 and x can be- a)Only 5
- b)Both 4 and 6
- c)Both 3 and 6
- d)3, 4 or 6
Correct answer is option 'D'. Can you explain this answer?
The mode of the data 6, 4, 3, 6, 4, 3, 4, 6, 5 and x can be
a)
Only 5
b)
Both 4 and 6
c)
Both 3 and 6
d)
3, 4 or 6
|
|
Ritu Saxena answered |
An observation which has more frequency in the data is called the mode of the data.
The median of the given data 41, 43, 127, 99, 61, 71, 92, 58, 57, is 61.If 58 is replaced by 85, then what is difference of the new median and the given median?- a)9
- b)8
- c)10
- d)12
Correct answer is option 'C'. Can you explain this answer?
The median of the given data 41, 43, 127, 99, 61, 71, 92, 58, 57, is 61.If 58 is replaced by 85, then what is difference of the new median and the given median?
a)
9
b)
8
c)
10
d)
12
|
|
Mira jain answered |
Calculation:
Given data:
41, 43, 127, 99, 61, 71, 92, 58, 57
Original median:
To find the median, we need to arrange the data in ascending order:
41, 43, 57, 58, 61, 71, 92, 99, 127
The median is the middle value, which is 61 in this case.
Updated data with 58 replaced by 85:
41, 43, 127, 99, 61, 71, 92, 85, 57
To find the new median, we need to arrange the updated data in ascending order:
41, 43, 57, 61, 71, 85, 92, 99, 127
The new median is the middle value, which is 71 in this case.
Difference in medians:
New median - Original median = 71 - 61 = 10
Therefore, the difference between the new median and the given median is 10. So, the correct answer is option c) 10.
Which of the following is not a measure of central tendency?- a)Mean
- b)Median
- c)Mode
- d)Standard deviation
Correct answer is option 'D'. Can you explain this answer?
Which of the following is not a measure of central tendency?
a)
Mean
b)
Median
c)
Mode
d)
Standard deviation
|
|
Kshitij goyal answered |
Introduction:
Measures of central tendency are statistical measures that help us understand the central or typical value of a dataset. They provide a summary of the data by giving us an idea of where most of the data points lie. The main measures of central tendency are the mean, median, and mode.
Explanation:
The correct answer is option 'D', which states that the standard deviation is not a measure of central tendency. Let's understand why this is the case:
Mean:
The mean is the sum of all the data values divided by the total number of values. It represents the arithmetic average of the dataset. The mean is a measure of central tendency as it shows the center or typical value around which the data points tend to cluster.
Median:
The median is the middle value in a dataset when the data points are arranged in ascending or descending order. It divides the dataset into two equal halves. The median is another measure of central tendency as it represents the value that lies at the center of the dataset.
Mode:
The mode is the value that occurs most frequently in a dataset. It represents the peak or most common value in the dataset. The mode is also a measure of central tendency as it shows the value around which the data points cluster the most.
Standard Deviation:
The standard deviation, on the other hand, is a measure of dispersion or variability in a dataset. It quantifies the average amount by which each data point deviates from the mean. It provides information about the spread of the data points around the mean, rather than focusing on a particular central value. Thus, the standard deviation is not a measure of central tendency.
Conclusion:
In summary, the standard deviation is not a measure of central tendency. It is a measure of dispersion or variability in a dataset. The mean, median, and mode are the main measures of central tendency, representing the center or typical value of a dataset.
The mean of 20 observations is 12.5. By error, one observation was noted as –15 instead of 15. Then the correct mean is _____. - a)11.75
- b)11
- c)14
- d)13
Correct answer is option 'C'. Can you explain this answer?
The mean of 20 observations is 12.5. By error, one observation was noted as –15 instead of 15. Then the correct mean is _____.
a)
11.75
b)
11
c)
14
d)
13
|
|
Sonia reddy answered |
Calculation of Correct Mean:
- Given Mean of 20 observations = 12.5
- One observation was noted incorrectly as -15 instead of 15
- Actual value of observation = 15
- Incorrect value noted = -15
Find the total of all observations:
- Total of 20 observations = 20 x 12.5 = 250
Find the total after correcting the error:
- Total after replacing -15 with 15 = 250 - (-15) + 15 = 250 + 15 + 15 = 280
Calculate the correct mean:
- Correct mean = Total / Number of observations
- Correct mean = 280 / 20 = 14
Therefore, the correct mean of the 20 observations is 14. So, the correct answer is option 'C' which is 14.
The arithmetic mean and mode of a data are 24 and 12 respectively. What is the median of that data?- a)18
- b)20
- c)23
- d)22
Correct answer is option 'B'. Can you explain this answer?
The arithmetic mean and mode of a data are 24 and 12 respectively. What is the median of that data?
a)
18
b)
20
c)
23
d)
22
|
|
Ritu Saxena answered |
∵ Mode = 3 Median - 2 Mean
∴ 12 = 3 Median - 2 × 24
⇒ Median = 60/3 = 20
∴ 12 = 3 Median - 2 × 24
⇒ Median = 60/3 = 20
If the arithmetic mean of x, x + 3, x + 6, x + 9, x + 12 is 10 then what is the value of x.- a)58
- b)5
- c)6
- d)4
Correct answer is option 'D'. Can you explain this answer?
If the arithmetic mean of x, x + 3, x + 6, x + 9, x + 12 is 10 then what is the value of x.
a)
58
b)
5
c)
6
d)
4
|
|
Ritu Saxena answered |
Given 
⇒ 5x + 30 = 50
⇒ 5x = 20 ⇒ x = 4

⇒ 5x + 30 = 50
⇒ 5x = 20 ⇒ x = 4
The median of a given frequency distribution is found graphically with the help of ____.- a)Histogram
- b)Frequency curve
- c)Frequency polygon
- d)Ogive
Correct answer is option 'D'. Can you explain this answer?
The median of a given frequency distribution is found graphically with the help of ____.
a)
Histogram
b)
Frequency curve
c)
Frequency polygon
d)
Ogive
|
|
Vivek Bansal answered |
Ogive or cumulative frequency curve is used to find the median.
The mean of 1, 3, 4, 5, 7, 4 is m. The numbers 3, 2, 2, 4, 3, 3, p have mean m – 1 and median q. Then, p + q =- a)4
- b)5
- c)6
- d)7
Correct answer is option 'D'. Can you explain this answer?
The mean of 1, 3, 4, 5, 7, 4 is m. The numbers 3, 2, 2, 4, 3, 3, p have mean m – 1 and median q. Then, p + q =
a)
4
b)
5
c)
6
d)
7
|
|
Urvashi das answered |
Mean and Median Calculation
- Given numbers: 1, 3, 4, 5, 7, 4
- Mean (m) = (1 + 3 + 4 + 5 + 7 + 4) / 6 = 24 / 6 = 4
Calculating p
- Given numbers with mean m - 1: 3, 2, 2, 4, 3, 3, p
- Sum of these numbers = 17 + p
- Mean = (17 + p) / 7 = m - 1 = 4 - 1 = 3
- 17 + p = 21
- p = 4
Finding Median q
- Since the numbers are already in ascending order: 2, 2, 3, 3, 3, 4, p
- Median q will be the middle number, which is the 4th number in this case, which is 3.
Calculating p + q
- p = 4, q = 3
- p + q = 4 + 3 = 7
Therefore, p + q = 7, which corresponds to option 'D'.
The average monthly income (in ₹) of certain agricultural workers is S and that of other workers is T. The number of agricultural workers are 11 times that of other workers. Then the average monthly income (in `)of all the workers is ____.- a)

- b)

- c)

- d)

Correct answer is option 'D'. Can you explain this answer?
The average monthly income (in ₹) of certain agricultural workers is S and that of other workers is T. The number of agricultural workers are 11 times that of other workers. Then the average monthly income (in `)of all the workers is ____.
a)

b)

c)

d)

|
|
Vivek Bansal answered |
Let the number of agricultural and other workers be n1 and n2.
∴ n1 = 11n2 ......(i)
Sum o f monthly income o f agricultural w orkers = Sn1
um of monthly income of other workers = Tn2
Sum of monthly income of all workers = Sn1 + Tn2
∴ Average monthly income of ail workers
=
=

The median of the following data is 525. Find the missing frequencies, if it is given that there are 100 observations in the data. - a)8, 14
- b)11, 17
- c)9, 15
- d)10, 16
Correct answer is option 'C'. Can you explain this answer?
The median of the following data is 525. Find the missing frequencies, if it is given that there are 100 observations in the data.
a)
8, 14
b)
11, 17
c)
9, 15
d)
10, 16
|
|
Ritu Saxena answered |
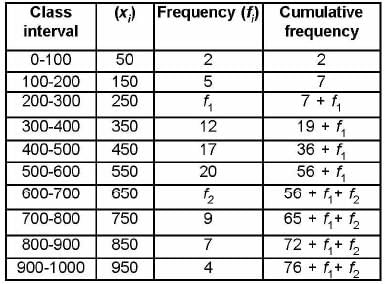
We have given n = 100
⇒ 76 + f1 + f2 = 100
⇒ f1 + f2 = 24 ....(i)
Since median is 525, so median class is 500 - 600.
Median = 


⇒ 25 = (14 - f1) x 5 ⇒ 25 = 70 - 5f
1
⇒ 5f1, = 45
⇒ f1 = 9
From (i), 9 + f2 = 24
⇒ f2 = 24 - 9 = 15
The median of first five natural numbers be 3. If 6 is included. then what is the median, Also find the difference of two medians respectively?- a)3.5, 0.5
- b)4, 1
- c)4.5, 1.5
- d)None of these
Correct answer is option 'A'. Can you explain this answer?
The median of first five natural numbers be 3. If 6 is included. then what is the median, Also find the difference of two medians respectively?
a)
3.5, 0.5
b)
4, 1
c)
4.5, 1.5
d)
None of these
|
|
Ritu Saxena answered |
First 5 natural numbers are 1, 2, 3, 4, 5 n = 5 (odd)
∴ Median = n +1/2 th = 5 + 1/2 th = 3rd term
⇒ Median = 3
1, 2, 3, 4, 5, 6
Median = 1/2 (3 + 4) = 7/2 = 3.5
Difference = 3 .5 - 3 = 0.5
∴ Median = n +1/2 th = 5 + 1/2 th = 3rd term
⇒ Median = 3
1, 2, 3, 4, 5, 6
Median = 1/2 (3 + 4) = 7/2 = 3.5
Difference = 3 .5 - 3 = 0.5
Candidat es of f our school appear in a mathematics test. The data is as follows: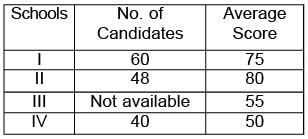 If the average score of the candidates of all the four schools is 66, find the number of candidates that appeared from school III.
- a)51
- b)52
- c)50
- d)53
Correct answer is option 'B'. Can you explain this answer?
Candidat es of f our school appear in a mathematics test. The data is as follows:

If the average score of the candidates of all the four schools is 66, find the number of candidates that appeared from school III.
a)
51
b)
52
c)
50
d)
53
|
|
Priyanka Kapoor answered |
Let the number of candidates that appeared from school Iii- be x.
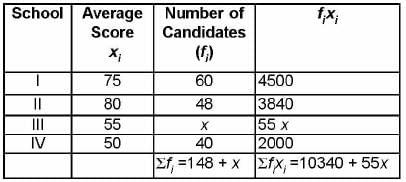
Average score of the candidates of all the four schools
= 

⇒ 9768 + 66 x = 10340 + 55 x
⇒ 11x = 572
⇒ x = 52
If 
- a)23
- b)24
- c)27
- d)25
Correct answer is option 'C'. Can you explain this answer?
If 

a)
23
b)
24
c)
27
d)
25
|
|
Vivek Bansal answered |

⇒ 

= 25 + 2 = 27
A bus maint ains an average s peed of 60 km/hr while going from P to Q and maintains an average speed of 90 km/hr while coming back from Q to P. The average speed of the bus is _____.- a)75 km/hr
- b)72 km/hr
- c)70 km/hr
- d)30 km/hr
Correct answer is option 'B'. Can you explain this answer?
A bus maint ains an average s peed of 60 km/hr while going from P to Q and maintains an average speed of 90 km/hr while coming back from Q to P. The average speed of the bus is _____.
a)
75 km/hr
b)
72 km/hr
c)
70 km/hr
d)
30 km/hr
|
|
Ritu Saxena answered |
A vera ge speed = Total distance covered / Total time taken
Let x be the distance between P and Q.
Thus, time taken by bus from P to Q (t1) = x/60
Thus, time taken by bus from Q to P (t
2
) = x/90Total distance covered = 2x and total time taken = t1 + t2
Average speed, = 

= 

= 72 km/hr
What is the median of the following distribution?
- a)7
- b)6
- c)5
- d)4
Correct answer is option 'C'. Can you explain this answer?
What is the median of the following distribution?

a)
7
b)
6
c)
5
d)
4
|
|
Ritu Saxena answered |
N = 8 + 10 + 11 +16 +20 +25 + 15 + 9 + 6 = 120
∴ N/2 = 120/2 = 60
60 lies in between 45 - 65
∴ Variate = 5
∴ N/2 = 120/2 = 60
60 lies in between 45 - 65
∴ Variate = 5
Find the mode for the following data.
- a)20.22
- b)19.47
- c)21.12
- d)20.14
Correct answer is option 'A'. Can you explain this answer?
Find the mode for the following data.

a)
20.22
b)
19.47
c)
21.12
d)
20.14
|
|
Vivek Bansal answered |
Since, maximum class frequency is 35, so the mode class is 18 - 24.
Now, Mode = 

= 

= 1 8 + 2.22 = 20.22
What is the mode of the given data?
7, 8, 5, 6, 8, 3, 12 ,11, 8, 6, 8, 7, 8, 5, 3, 8- a)8
- b)6
- c)5
- d)3
Correct answer is option 'A'. Can you explain this answer?
What is the mode of the given data?
7, 8, 5, 6, 8, 3, 12 ,11, 8, 6, 8, 7, 8, 5, 3, 8
7, 8, 5, 6, 8, 3, 12 ,11, 8, 6, 8, 7, 8, 5, 3, 8
a)
8
b)
6
c)
5
d)
3
|
|
Ritu Saxena answered |
Here the frequency of 8 is maximum. (6 times)
∴ Mode = 8
∴ Mode = 8
What is the mode of the following distribution?
- a)14.6
- b)15.6
- c)12.6
- d)13.6
Correct answer is option 'A'. Can you explain this answer?
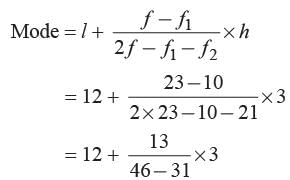
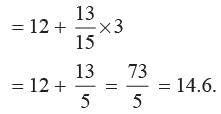
What is the mode of the following distribution?

a)
14.6
b)
15.6
c)
12.6
d)
13.6
|
|
Ritu Saxena answered |

Class 12 - 15 has maximum frequency.
12 - 15 is the modal class
Find the median of the following data
- a)30
- b)40
- c)35
- d)45
Correct answer is option 'B'. Can you explain this answer?
Find the median of the following data

a)
30
b)
40
c)
35
d)
45
|
|
Ritu Saxena answered |

N = 60
N/2 = 30
c.f just greater than 30 is 50
Median class is 30 - 60
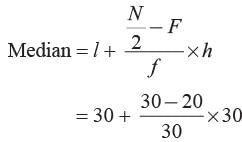
= 30 + 10 = 40
What is the value of P, if the mean of the following distribution is 7.5?
- a)3
- b)6
- c)5
- d)7
Correct answer is option 'A'. Can you explain this answer?
What is the value of P, if the mean of the following distribution is 7.5?

a)
3
b)
6
c)
5
d)
7
|
|
Ritu Saxena answered |
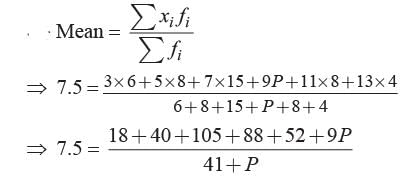
⇒ 307.5 + 7.5P = 303 + 9P
⇒ 1.5 P = 4.5 ⇒ P = 4.5/1.5 = 3
If the mean of following distribution is 25, then what is the value of x?

- a)2
- b)4
- c)6
- d)8
Correct answer is option 'A'. Can you explain this answer?
If the mean of following distribution is 25, then what is the value of x?


a)
2
b)
4
c)
6
d)
8
|
|
Ritu Saxena answered |

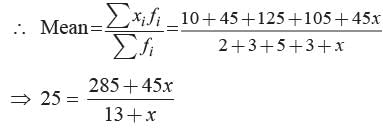
⇒ 325 + 25x = 285 + 45x
⇒ 20x = 40 ⇒ x = 40/20 = 2
In the given distribution, which is the modal class?

- a)0-10
- b)40-50
- c)30-40
- d)20-30
Correct answer is option 'C'. Can you explain this answer?
In the given distribution, which is the modal class?


a)
0-10
b)
40-50
c)
30-40
d)
20-30
|
|
Ritu Saxena answered |
The class having maximum frequency is called modal class i.e. 30–40.
Find the value of p , if the mean of the following data is 20.
- a)2
- b)1
- c)4
- d)10
Correct answer is option 'B'. Can you explain this answer?
Find the value of p , if the mean of the following data is 20.

a)
2
b)
1
c)
4
d)
10
|
|
Vivek Bansal answered |
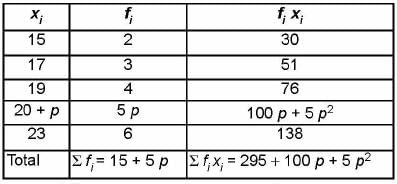
Mean = 

⇒ 20 (15 + 5 p) = 295 + 100 p + 5 p2
⇒ 300 + 100 p = 295 + 100 p + 5 p2
⇒ 5p2 = 5
⇒ p2 = ±1 ⇒ p = 1 ( ∵p ≠ - 1)
Fill in the blanks.(i) For a given data with 110 observations the ‘less than ogive’ and ‘more than ogive’ intersect at (18, 20). The median of the data is __P__ .(ii) The curve is drawn by taking upper limit of class interval along x-axis and cumulating frequency along y-axis is __Q__ than ogive.(iii) T he m ean of 50 num ber s is 18, the new mean will be __R__ if each observation is increased by 4.(iv) The mean of seven consecutive natural numbers is 20, then the largest number is __S__ and smallest number of them is __T__ .P, Q, R, S, T- a)18, Less, 22, 23, 17
- b)20, More, 25, 22, 16
- c)18, More, 22, 24, 18
- d)20, Less, 25, 22, 16
Correct answer is option 'A'. Can you explain this answer?
Fill in the blanks.
(i) For a given data with 110 observations the ‘less than ogive’ and ‘more than ogive’ intersect at (18, 20). The median of the data is __P__ .
(ii) The curve is drawn by taking upper limit of class interval along x-axis and cumulating frequency along y-axis is __Q__ than ogive.
(iii) T he m ean of 50 num ber s is 18, the new mean will be __R__ if each observation is increased by 4.
(iv) The mean of seven consecutive natural numbers is 20, then the largest number is __S__ and smallest number of them is __T__ .
P, Q, R, S, T
a)
18, Less, 22, 23, 17
b)
20, More, 25, 22, 16
c)
18, More, 22, 24, 18
d)
20, Less, 25, 22, 16
|
|
Ritu Saxena answered |
(i) The intersection point of less than ogive and more than ogive, the x-coordinate is the median. Median is 18.
(ii) Less than ogive is drawn by taking the upper limit of class interval along x-axis and their corresponding less than cumulative frequencies along y-axis.
(iii) Sum of 50 numbers = 50 x 18 = 900
If each number is increased by 4, then
new sum = 900 + 4 x 50 = 1100
∴ New Mean = 1100/50 = 22
(iv) Let seven consecutive numbers are x, x + 1, x + 2, ...., x + 6.
Mean = 

⇒ 

Smallest number x = 17 Largest number = x + 6 = 17 + 6 = 23.
Find the median for the following distribution of workers. 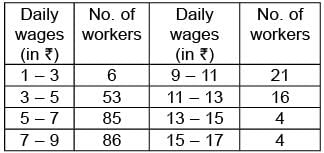
- a)7.14
- b)6.84
- c)5.92
- d)5.57
Correct answer is option 'B'. Can you explain this answer?
Find the median for the following distribution of workers.

a)
7.14
b)
6.84
c)
5.92
d)
5.57
|
|
Priyanka Kapoor answered |
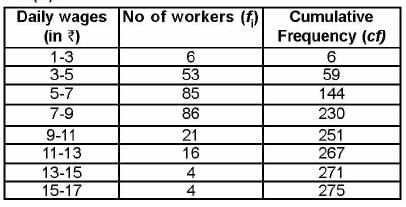 Here,n = 275 ⇒ n/2 = 137.5
 Median class is 5 - 7
Median = 

= 

= 5 + 1.84 = 6.84
Find the mean, median and mode of the following data. Mean, Median, Mode
- a)50.67 - 62.67 - 64.5
- b)60.67 - 52.42 - 64.5
- c)62.4 - 61.67 - 60.21
- d)62.4 - 62.42 - 65
Correct answer is option 'C'. Can you explain this answer?
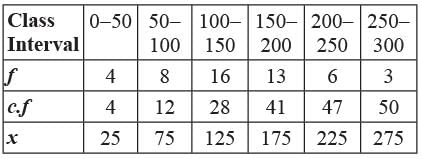
Find the mean, median and mode of the following data.

Mean, Median, Mode
a)
50.67 - 62.67 - 64.5
b)
60.67 - 52.42 - 64.5
c)
62.4 - 61.67 - 60.21
d)
62.4 - 62.42 - 65
|
|
Ritu Saxena answered |
To find the mean let us put the data in the table given below:


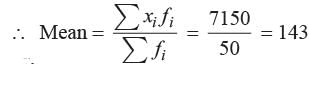
Thus, the mean of the given data is 62.4.
Now, to find the median let us put the data in the table given below:

Now, N = 50 ⇒ N/2 = 25.
The cumulative frequency just greater than 25 is 36 and the corresponding class is 60 – 80.
Thus, the median class is 60 – 80.
∴ l = 60, h = 20, N = 50, f = 12 and cf = 24.
Now,

Hence, Mean = 62.4, Median = 61.67 and Mode = 60.21
Thus, the mean of the given data is 62.4.
Now, to find the median let us put the data in the table given below:
Now, N = 50 ⇒ N/2 = 25.
The cumulative frequency just greater than 25 is 36 and the corresponding class is 60 – 80.
Thus, the median class is 60 – 80.
∴ l = 60, h = 20, N = 50, f = 12 and cf = 24.
Now,
Hence, Mean = 62.4, Median = 61.67 and Mode = 60.21
In an examination of 675 candidates of maximum marks 100 the examiner supplied the following information.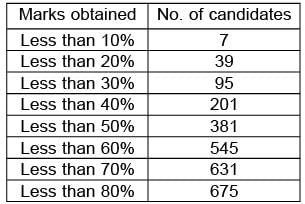 Calculate median and mode respectively of the percentage marks obtained.
- a)47.58 , 46.33
- b)49.12, 48.22
- c)45.24, 46.22
- d)47.58, 48.22
Correct answer is option 'D'. Can you explain this answer?
In an examination of 675 candidates of maximum marks 100 the examiner supplied the following information.

Calculate median and mode respectively of the percentage marks obtained.
a)
47.58 , 46.33
b)
49.12, 48.22
c)
45.24, 46.22
d)
47.58, 48.22
|
|
Ritu Saxena answered |
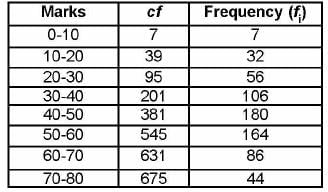
Here, n = 675
⇒ n/2 = 337.5
So, Median class 40 - 50.
Median = 

= 

= 40 + 7.58 = 47.58
Now, maximum frequency is 180.
So, modal class is 40 - 50.
So, modal class is 40 - 50.
Mode =

= 

= 48.22
What is the mode of the given data?
- a)12
- b)16
- c)15
- d)18
Correct answer is option 'C'. Can you explain this answer?
What is the mode of the given data?

a)
12
b)
16
c)
15
d)
18
|
|
Ritu Saxena answered |
The variate having highest frequency is the mode.
Chapter doubts & questions for Statistics - Year 5 Mathematics 2025 is part of Year 5 exam preparation. The chapters have been prepared according to the Year 5 exam syllabus. The Chapter doubts & questions, notes, tests & MCQs are made for Year 5 2025 Exam. Find important definitions, questions, notes, meanings, examples, exercises, MCQs and online tests here.
Chapter doubts & questions of Statistics - Year 5 Mathematics in English & Hindi are available as part of Year 5 exam.
Download more important topics, notes, lectures and mock test series for Year 5 Exam by signing up for free.
Year 5 Mathematics
45 videos|60 docs|15 tests
|

Contact Support
Our team is online on weekdays between 10 AM - 7 PM
Typical reply within 3 hours
|
Free Exam Preparation
at your Fingertips!
Access Free Study Material - Test Series, Structured Courses, Free Videos & Study Notes and Prepare for Your Exam With Ease

 Join the 10M+ students on EduRev
|

|
Create your account for free
OR
Forgot Password
OR
Signup on EduRev and stay on top of your study goals
10M+ students crushing their study goals daily

