


All Exams >
JAMB >
Mathematics for JAMB >
All Questions
All questions of Statistics for JAMB Exam
The mean of 5 observations is 4.4 and their variance is 8.24. If three observations are 1,2 and 6 , the other two observations are- a)4 and 8
- b)5 and 7
- c)5 and 9
- d)4 and 9
Correct answer is option 'D'. Can you explain this answer?
The mean of 5 observations is 4.4 and their variance is 8.24. If three observations are 1,2 and 6 , the other two observations are
a)
4 and 8
b)
5 and 7
c)
5 and 9
d)
4 and 9
|
|
Gaurav Kumar answered |
Let the other nos. be a and b
then (x+y+1+2+6)/5 = 4.4
x + y = 13 ---------------------(1)
Variance = 8.24
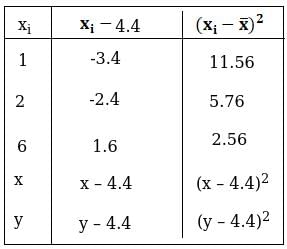
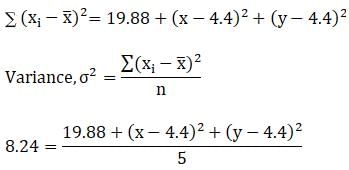
41.2 = 19.88 + (x2 + 19.36 – 8.8x) + (y2 + 19.36 – 8.8y)
21.32 = x2 + y2 + 38.72 – 8.8(x + y)
x2 + y2 + 38.72 – 8.8(13) – 21.32 = 0
(using equation (1))
x2 + y2 – 97 = 0 …(2)
Squaring equation (1) both the sides,
we get (x + y)2 = (13)^2
x2 + y2 + 2xy = 169
97 + 2xy = 169
(using equation (2))
xy = 36 or x = 36/y (1)
⇒ 36/y + y = 13
y2 + 36 = 13y
y2 – 13y + 36 = 0
(y – 4)(y – 9) = 0
Either (y – 4) = 0 or (y – 9) = 0
⇒ y = 4 or y = 9
For y = 4 x = 36/y
= 36/4 = 12
For y = 9
x = 36/9
x = 4
Thus, remaining two observations are 4 and 9.
then (x+y+1+2+6)/5 = 4.4
x + y = 13 ---------------------(1)
Variance = 8.24
41.2 = 19.88 + (x2 + 19.36 – 8.8x) + (y2 + 19.36 – 8.8y)
21.32 = x2 + y2 + 38.72 – 8.8(x + y)
x2 + y2 + 38.72 – 8.8(13) – 21.32 = 0
(using equation (1))
x2 + y2 – 97 = 0 …(2)
Squaring equation (1) both the sides,
we get (x + y)2 = (13)^2
x2 + y2 + 2xy = 169
97 + 2xy = 169
(using equation (2))
xy = 36 or x = 36/y (1)
⇒ 36/y + y = 13
y2 + 36 = 13y
y2 – 13y + 36 = 0
(y – 4)(y – 9) = 0
Either (y – 4) = 0 or (y – 9) = 0
⇒ y = 4 or y = 9
For y = 4 x = 36/y
= 36/4 = 12
For y = 9
x = 36/9
x = 4
Thus, remaining two observations are 4 and 9.

If the coefficient of variation between x and y is 0.28, covariance between x and y is 7.6, and the variance of x is 9, then the S.D. of the y series is- a)10.05
- b)10.1
- c)9.05
- d)9.8
Correct answer is option 'C'. Can you explain this answer?
If the coefficient of variation between x and y is 0.28, covariance between x and y is 7.6, and the variance of x is 9, then the S.D. of the y series is
a)
10.05
b)
10.1
c)
9.05
d)
9.8
|
|
Hansa Sharma answered |
Correlation coefficient = cov (x,y)/ (std deviation (x) ×std deviation (y))
Correlation coefficient = 0.28
cov (x,y) = 7.6
variance of x is 9.
=> std deviation (x) = √variance of X = √9 = 3
=> 0.28 = 7.6 / ( 3 * std deviation (y))
=> std deviation (y) = 7.6 / ( 3 * 0.28)
=> std deviation (y) = 9.05
standard deviation of Y series = 9.05
Correlation coefficient = 0.28
cov (x,y) = 7.6
variance of x is 9.
=> std deviation (x) = √variance of X = √9 = 3
=> 0.28 = 7.6 / ( 3 * std deviation (y))
=> std deviation (y) = 7.6 / ( 3 * 0.28)
=> std deviation (y) = 9.05
standard deviation of Y series = 9.05
The two lines of regression are 2x - 7y + 6 = 0 and 7x – 2y +1 = 0. What is correlation coefficient between x and y ?- a)4/49
- b)- 2/7
- c)2/7
- d)none of these
Correct answer is option 'C'. Can you explain this answer?
The two lines of regression are 2x - 7y + 6 = 0 and 7x – 2y +1 = 0. What is correlation coefficient between x and y ?
a)
4/49
b)
- 2/7
c)
2/7
d)
none of these
|
|
Hansa Sharma answered |
ρ = (b(xy) * b(yx))
But sign of ρρ is same as sign of b(xy), b(yx)
Therefore, ρ = 2/7
But sign of ρρ is same as sign of b(xy), b(yx)
Therefore, ρ = 2/7
If the mean of numbers 27,31,89,107,156 is 82, then the mean of 130,126,68,50,1 is :- a)75
- b)82
- c)80
- d)157
Correct answer is option 'A'. Can you explain this answer?
If the mean of numbers 27,31,89,107,156 is 82, then the mean of 130,126,68,50,1 is :
a)
75
b)
82
c)
80
d)
157

|
Pratyush Rajwansh answered |
It is because the mean is the same as of average sum of the total number is divided by the total number of numbers present. (130+126+68+50+1)/5 =75
If the mean of the squares of first n natural numbers be 11, then n is equal to- a)13
- b)5
- c)- 13/2
- d)11
Correct answer is option 'B'. Can you explain this answer?
If the mean of the squares of first n natural numbers be 11, then n is equal to
a)
13
b)
5
c)
- 13/2
d)
11

|
Learners Habitat answered |
The mean of the squares of the first n natural numbers is given by:
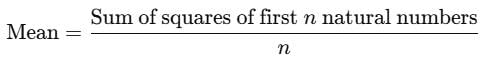
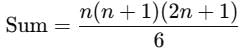
The sum of the squares of the first n natural numbers is:
Thus, the mean is:
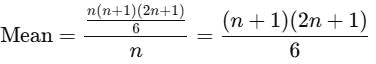
We are given that the mean is 11. Therefore:
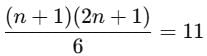
Multiply through by 6:
(n+1)(2n+1)=66
Expand:
2n2 +3n+1=66
Simplify:
2n2+3n−65=0
Solve this quadratic equation using the quadratic formula:
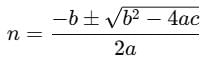
Here, a=2, b=3, and c=−65:
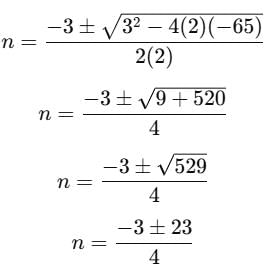
Calculate the two solutions:
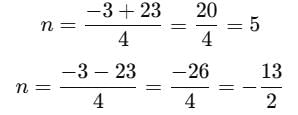
Since n must be a positive integer, n=5.
The sum of the squares of the first n natural numbers is:
Thus, the mean is:
We are given that the mean is 11. Therefore:
Multiply through by 6:
(n+1)(2n+1)=66
Expand:
2n2 +3n+1=66
Simplify:
2n2+3n−65=0
Solve this quadratic equation using the quadratic formula:
Here, a=2, b=3, and c=−65:
Calculate the two solutions:
Since n must be a positive integer, n=5.
The Q.D. of the daily wages (in Rs) of 7 persons given below: 12,7,15,10,17,19,25 is- a)4.5
- b)9
- c)5
- d)14.5
Correct answer is option 'A'. Can you explain this answer?
The Q.D. of the daily wages (in Rs) of 7 persons given below: 12,7,15,10,17,19,25 is
a)
4.5
b)
9
c)
5
d)
14.5
|
|
Arshiya Shah answered |
Q.D. of Daily Wages of 7 Persons
To find the Q.D. (Quartile Deviation) of the daily wages of 7 persons given below: 12, 7, 15, 10, 17, 19, 25, we need to follow the steps given below:
Step 1: Arrange the data in ascending order.
7, 10, 12, 15, 17, 19, 25
Step 2: Find the median or the second quartile (Q2) of the data.
Median of the data = (n + 1)/2-th value = (7 + 1)/2-th value = 4th value
Hence, median = 15
Step 3: Find the first quartile (Q1) of the data.
Q1 = (n + 1)/4-th value = (7 + 1)/4-th value = 2nd value
Hence, Q1 = 10
Step 4: Find the third quartile (Q3) of the data.
Q3 = 3(n + 1)/4-th value = 3(7 + 1)/4-th value = 6th value
Hence, Q3 = 19
Step 5: Calculate the Quartile Deviation (Q.D.) using the formula:
Q.D. = (Q3 - Q1)/2
Substituting the values of Q1 and Q3, we get:
Q.D. = (19 - 10)/2 = 4.5
Therefore, the Q.D. of the daily wages of 7 persons given is 4.5.
Note: Quartile deviation is a measure of dispersion that gives an idea about the spread of data around the median. It is calculated as half of the difference between the third and first quartiles.
A man tavels at a speed of 20 km/hour and then return at a speed of 30 km/hour. His average speed of the whole journey is- a)24 km/hour
- b)26 km/hour
- c)25 km/hour
- d)24.5 km/hour
Correct answer is option 'A'. Can you explain this answer?
A man tavels at a speed of 20 km/hour and then return at a speed of 30 km/hour. His average speed of the whole journey is
a)
24 km/hour
b)
26 km/hour
c)
25 km/hour
d)
24.5 km/hour
|
|
Nabanita Bajaj answered |
Solution:
The average speed of the whole journey is given by the formula:
Average speed = Total distance / Total time
Let's assume that the distance travelled by the man in one direction is 'd' km.
Therefore, the total distance travelled by the man in the whole journey is 2d km.
Let's also assume that the time taken by the man to travel 'd' km at a speed of 20 km/hour is 't1' hours.
Therefore, the time taken by the man to travel 'd' km at a speed of 30 km/hour is 't2' hours.
Using the formula:
Time = Distance / Speed
We can write:
t1 = d / 20 and t2 = d / 30
Therefore, the total time taken by the man in the whole journey is:
Total time = t1 + t2 = d / 20 + d / 30 = (3d + 2d) / (60) = 5d / 60 = d / 12 hours
Using the formula for average speed, we get:
Average speed = Total distance / Total time
= 2d / (d / 12)
= 24 km/hour
Therefore, the correct answer is option 'A' - 24 km/hour.
The mean of the first n terms of the A.P. (a + d) + (a + 3d) + (a + 5d) +………..is- a)

- b)a + n2d
- c)a + nd
- d)none of these
Correct answer is option 'C'. Can you explain this answer?
The mean of the first n terms of the A.P. (a + d) + (a + 3d) + (a + 5d) +………..is
a)
b)
a + n2d
c)
a + nd
d)
none of these

|
Manish Aggarwal answered |
The given arithmetic progression (AP) is:
(a+d),(a+3d),(a+5d),…
This sequence has a common difference of 2d.
Step 1: General term
The n-th term of this AP is given by:
Tn =a+(2n−1)d
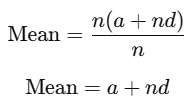
Step 2: Sum of the first n terms
The sum of the first n terms of an AP is:
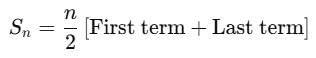
Here: First term = a+d
Last term = Tn =a+(2n−1)d
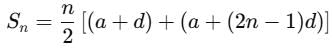
Simplify the terms:
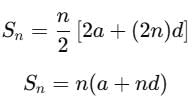
Step 3: Mean of the first n terms
The mean of the first n terms is:
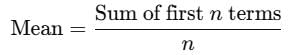
Substitute Sn:
(a+d),(a+3d),(a+5d),…
This sequence has a common difference of 2d.
Step 1: General term
The n-th term of this AP is given by:
Tn =a+(2n−1)d
Step 2: Sum of the first n terms
The sum of the first n terms of an AP is:
Here: First term = a+d
Last term = Tn =a+(2n−1)d
Simplify the terms:
Step 3: Mean of the first n terms
The mean of the first n terms is:
Substitute Sn:
The S.D. of the observations 22,26,28,20,24,30 is- a)3
- b)2.4
- c)3.42
- d)2
Correct answer is option 'C'. Can you explain this answer?
The S.D. of the observations 22,26,28,20,24,30 is
a)
3
b)
2.4
c)
3.42
d)
2
|
|
Lavanya Menon answered |
μ = (22 + 26 + 28 + 20 + 24 + 30)/6
= 150/6
= 25
x(i) = (xi - μ)2
x(22) = (22-25)2 = 9
x(26) = (26-25)2 = 1
x(28) = (28-25)2 = 9
x(20) = (20-25)2 = 25
x(24) = (24-25)2 = 1
x(30) = (30-25)2 = 25
(xi - μ)2 = 70
Standard deviation : [(xi - μ)2]/N
= (70/6)½
= 3.42
= 150/6
= 25
x(i) = (xi - μ)2
x(22) = (22-25)2 = 9
x(26) = (26-25)2 = 1
x(28) = (28-25)2 = 9
x(20) = (20-25)2 = 25
x(24) = (24-25)2 = 1
x(30) = (30-25)2 = 25
(xi - μ)2 = 70
Standard deviation : [(xi - μ)2]/N
= (70/6)½
= 3.42
Coefficient of correlation between the observations (1, 6) , (2 , 5) , (3 , 4) , (4 , 3) , (5 , 2) , (6 , 1) is- a)0
- b)1
- c)-1
- d)none of these
Correct answer is option 'C'. Can you explain this answer?
Coefficient of correlation between the observations (1, 6) , (2 , 5) , (3 , 4) , (4 , 3) , (5 , 2) , (6 , 1) is
a)
0
b)
1
c)
-1
d)
none of these
|
|
Shanaya Shah answered |
Given observations: (1, 6), (2, 5), (3, 4), (4, 3), (5, 2), (6, 1)
To find the coefficient of correlation, we need to first calculate the mean and standard deviation of both the variables.
Let X be the first variable and Y be the second variable.
Calculating mean:
- Mean of X = (1+2+3+4+5+6)/6 = 3.5
- Mean of Y = (6+5+4+3+2+1)/6 = 3.5
Calculating standard deviation:
- Standard deviation of X = sqrt((1-3.5)^2 + (2-3.5)^2 + (3-3.5)^2 + (4-3.5)^2 + (5-3.5)^2 + (6-3.5)^2) = 1.87
- Standard deviation of Y = sqrt((6-3.5)^2 + (5-3.5)^2 + (4-3.5)^2 + (3-3.5)^2 + (2-3.5)^2 + (1-3.5)^2) = 1.87
Calculating the coefficient of correlation using the formula:
r = Σ((Xi - X̄)(Yi - Ȳ))/sqrt(Σ(Xi - X̄)^2 * Σ(Yi - Ȳ)^2)
Substituting the values,
r = ((-2.5)*4.5 + (-1.5)*2.5 + (-0.5)*0.5 + 0.5*2.5 + 1.5*4.5 + 2.5*6.5)/(1.87^2 * 1.87^2 * 6)
r = -1
Therefore, the coefficient of correlation between the given observations is -1, which indicates a perfect negative correlation.
A batsman scores runs in 10 innings 38,70,48,34,42,55,63,46,54 and 44 , then the mean deviation is- a)6.4
- b)9.6
- c)10.6
- d)8.6
Correct answer is option 'D'. Can you explain this answer?
A batsman scores runs in 10 innings 38,70,48,34,42,55,63,46,54 and 44 , then the mean deviation is
a)
6.4
b)
9.6
c)
10.6
d)
8.6
|
|
Jyoti Sengupta answered |
Arranging the given data in ascending order,
we have 34, 38, 42, 44, 46, 48, 54, 55, 63, 70
Here, Median M = (46+48)/2
=47
(∵ n = 10, median is the mean of 5th and 6th items)
∴ Mean deviation = ∑|xi−M|/n
=∑|xi−47|/10
= (13+9+5+3+1+1+7+8+16+23)/10
=8.6
we have 34, 38, 42, 44, 46, 48, 54, 55, 63, 70
Here, Median M = (46+48)/2
=47
(∵ n = 10, median is the mean of 5th and 6th items)
∴ Mean deviation = ∑|xi−M|/n
=∑|xi−47|/10
= (13+9+5+3+1+1+7+8+16+23)/10
=8.6
The H.M. of 4,8,16 is- a)6.7
- b)7.8
- c)6.85
- d)6.4
Correct answer is option 'C'. Can you explain this answer?
The H.M. of 4,8,16 is
a)
6.7
b)
7.8
c)
6.85
d)
6.4
|
|
Vivek answered |
HM = 3*(1/4 + 1/8 + 1/16)-¹
= 6.85
KEY POINT →→ HM of n terms = n*[1/a + 1/b + (upto
n terms) ]-¹
If in moderately asymmetrical distribution mode and mean of the data are 6 μ and 9 μ respectively, then median is- a)8 μ
- b)6 μ
- c)5 μ
- d)7 μ
Correct answer is option 'A'. Can you explain this answer?
If in moderately asymmetrical distribution mode and mean of the data are 6 μ and 9 μ respectively, then median is
a)
8 μ
b)
6 μ
c)
5 μ
d)
7 μ
|
|
Ananya Das answered |
Median = [mode + 2(mean)]/3
= [6μ+2(9μ)]/3
= 24μ/3
= 8μ
= [6μ+2(9μ)]/3
= 24μ/3
= 8μ


The Mode of the following items is 0,1,6,7,2,3,7,6,6,2,6,0,5,6,0.- a)2
- b)5
- c)0
- d)6
Correct answer is option 'D'. Can you explain this answer?
The Mode of the following items is 0,1,6,7,2,3,7,6,6,2,6,0,5,6,0.
a)
2
b)
5
c)
0
d)
6
|
|
Manish Aggarwal answered |
To find the mode, we count how many times each number appears:
- 0 appears 3 times.
- 1 appears 1 time.
- 6 appears 5 times.
- 7 appears 2 times.
- 2 appears 2 times.
- 3 appears 1 time.
- 5 appears 1 time.
Since 6 occurs the most frequently (5 times), the mode is 6.
Thus, the correct answer is:
D: 6
If the two lines of regression of a bivariate distribution coincide, then the correlation coefficient ρρsatisfies.- a)ρ = 0
- b)ρ > 0
- c)ρ = 1 or −1
- d)ρ < 0
Correct answer is option 'C'. Can you explain this answer?
If the two lines of regression of a bivariate distribution coincide, then the correlation coefficient ρρsatisfies.
a)
ρ = 0
b)
ρ > 0
c)
ρ = 1 or −1
d)
ρ < 0
|
|
Naina Bansal answered |
If the two lines of regression of a bivariate distribution coincide, it means that there is a perfect linear relationship between the two variables. This can happen in two cases:
The two variables are perfectly positively correlated, meaning that as one variable increases, the other variable also increases by a fixed amount. In this case, the correlation coefficient will be equal to 1.
The two variables are perfectly negatively correlated, meaning that as one variable increases, the other variable decreases by a fixed amount. In this case, the correlation coefficient will be equal to -1.
Therefore, if the two lines of regression of a bivariate distribution coincide, the correlation coefficient will be equal to 1 or -1.
The correct answer is therefore (c) ρ = 1 or −1.
The two lines of regression are x + 4y = 3 and 3x +y = 15. value of x for y = 3 is- a)- 4
- b)4
- c)- 9
- d)none of these
Correct answer is option 'B'. Can you explain this answer?
The two lines of regression are x + 4y = 3 and 3x +y = 15. value of x for y = 3 is
a)
- 4
b)
4
c)
- 9
d)
none of these

|
Pragati Nair answered |
We have x + 4y = 3 and 3x + y = 15 as the lines of regression of y on x and x on y respectively.
Therefore, for y = 3 the required line is x on y
so put y= 3 in 3x + y = 15
we get, x = 4
Therefore, for y = 3 the required line is x on y
so put y= 3 in 3x + y = 15
we get, x = 4
If the median = (mode + 2 mean) μ, then μ is equal to- a)3
- b)1/3
- c)2/3
- d)2
Correct answer is option 'B'. Can you explain this answer?
If the median = (mode + 2 mean) μ, then μ is equal to
a)
3
b)
1/3
c)
2/3
d)
2
|
|
Muskaan Singh answered |
If the median equals the mode plus twice the mean, we can express this relationship mathematically as:
Median = Mode + 2 * Mean
Median = Mode + 2 * Mean
If the mean of the first n odd natural numbers be n itself, then n is equal to- a)3
- b)any natural number
- c)2
- d)1
Correct answer is option 'B'. Can you explain this answer?
If the mean of the first n odd natural numbers be n itself, then n is equal to
a)
3
b)
any natural number
c)
2
d)
1

|
Tarun Kaushik answered |
The first n odd natural numbers are 1,3,5,…,(2n−1). The mean of these numbers is calculated as:
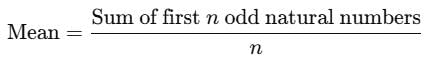
The sum of the first n odd natural numbers is:
Sum=n2
So, the mean becomes:
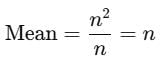
We are given that the mean is equal to n itself. This equality holds true for any natural number n.
The sum of the first n odd natural numbers is:
Sum=n2
So, the mean becomes:
We are given that the mean is equal to n itself. This equality holds true for any natural number n.
For a normal distribution, we have- a)mean = median = mode
- b)mean = mode
- c)median = mode
- d)mean = median
Correct answer is option 'A'. Can you explain this answer?
For a normal distribution, we have
a)
mean = median = mode
b)
mean = mode
c)
median = mode
d)
mean = median

|
Nipuns Institute answered |
For a normal distribution, the following property holds:
Mean=Median=Mode
This is because a normal distribution is symmetric about its center, and the mean, median, and mode all lie at the same central point.
Mean=Median=Mode
This is because a normal distribution is symmetric about its center, and the mean, median, and mode all lie at the same central point.
Least square lines of regression give best possible estimates, when ρ(X,Y) is equal to- a)- 1 or 1
- b)less than 1
- c)greater than -1
- d)1/ 2
Correct answer is option 'A'. Can you explain this answer?
Least square lines of regression give best possible estimates, when ρ(X,Y) is equal to
a)
- 1 or 1
b)
less than 1
c)
greater than -1
d)
1/ 2
|
|
Learners Habitat answered |
The least square lines of regression provide the best possible estimates when the correlation coefficient ρ(X,Y) is equal to 1 or -1. This is because a correlation of ρ=1 or ρ=−1 indicates a perfect linear relationship between X and Y, meaning one variable can be predicted exactly from the other using the regression line.
If the two lines of regression are at right angles, then ρ(X,Y) is equal to- a)- 1
- b)0
- c)1
- d)1 or - 1
Correct answer is option 'B'. Can you explain this answer?
If the two lines of regression are at right angles, then ρ(X,Y) is equal to
a)
- 1
b)
0
c)
1
d)
1 or - 1

|
EduRev JEE answered |
If the two lines of regression are at right angles, it means that the product of their slopes is −1. This happens only when the correlation coefficient ρ(X,Y) is 0.
The correlation coefficient measures the linear relationship between two variables. Whe ρ(X,Y)=0, the two lines of regression are perpendicular, indicating no linear correlation.
The correlation coefficient measures the linear relationship between two variables. Whe ρ(X,Y)=0, the two lines of regression are perpendicular, indicating no linear correlation.
The statistical method which helps us to estimate or predict the unknown value of one variable from the known value of the related variable is called- a)correlation
- b)regression
- c)scatter diagram
- d)dispersion
Correct answer is option 'B'. Can you explain this answer?
The statistical method which helps us to estimate or predict the unknown value of one variable from the known value of the related variable is called
a)
correlation
b)
regression
c)
scatter diagram
d)
dispersion
|
|
Disha Bajaj answered |
Regression is the statistical method that helps us estimate or predict the unknown value of one variable from the known value of a related variable. It is widely used in various fields such as economics, finance, social sciences, and engineering to analyze and model the relationship between variables.
Explanation:
Regression involves finding a mathematical equation that best describes the relationship between two or more variables. It is based on the concept of a dependent variable and one or more independent variables. The dependent variable is the variable that we want to estimate or predict, while the independent variables are the known values that we use to make the estimation or prediction.
Key Points:
- Regression analysis helps us understand the relationship between variables and enables us to make predictions or estimations based on this relationship.
- It is often used to examine how changes in one variable are associated with changes in another variable.
- The most common type of regression analysis is simple linear regression, which assumes a linear relationship between the variables.
- In simple linear regression, the equation takes the form of Y = a + bX, where Y is the dependent variable, X is the independent variable, a is the intercept, and b is the slope.
- The intercept represents the value of the dependent variable when the independent variable is zero, while the slope represents the change in the dependent variable for a one-unit increase in the independent variable.
- Regression analysis can also be extended to multiple regression, where there are more than one independent variables.
- Multiple regression allows us to account for the effects of multiple variables on the dependent variable and can provide more accurate predictions.
- Regression analysis is typically performed using statistical software, which calculates the coefficients of the equation and provides measures of the goodness of fit and statistical significance.
In conclusion, regression is a powerful statistical method that allows us to estimate or predict unknown values based on known values of related variables. It is widely used in various fields to analyze and model relationships between variables, providing valuable insights and predictions.
If x and y are related as y – 4x = 3, then the nature of correlation between x and y is- a)perfect negative
- b)no correlation
- c)perfect positive
- d)none of these
Correct answer is option 'C'. Can you explain this answer?
If x and y are related as y – 4x = 3, then the nature of correlation between x and y is
a)
perfect negative
b)
no correlation
c)
perfect positive
d)
none of these
|
|
Rohan Singh answered |
Positive correlation is a relationship between two variables in which both variables move in tandem. A positive correlation exists when one variable decreases as the other variable decreases, or one variable increases while the other increases.
For a symmetrical distribution Q1 = 20 and Q3. = 40. The median of the data is- a)10
- b)40
- c)20
- d)30
Correct answer is option 'D'. Can you explain this answer?
For a symmetrical distribution Q1 = 20 and Q3. = 40. The median of the data is
a)
10
b)
40
c)
20
d)
30
|
|
Gauri Rane answered |
Understanding Symmetrical Distribution
In a symmetrical distribution, the data is evenly distributed around its central point, which is the median. The key characteristics of this distribution are:
- The mean, median, and mode are all equal.
- The quartiles (Q1 and Q3) divide the data into segments.
Given Values
- Q1 (First Quartile) = 20
- Q3 (Third Quartile) = 40
In a symmetrical distribution, the median can be found using the following relationship between quartiles:
Median Calculation
- The median lies exactly halfway between Q1 and Q3 in a symmetrical distribution.
- To find the median, you can use the formula:
Median = (Q1 + Q3) / 2
Substituting the given values:
- Median = (20 + 40) / 2
- Median = 60 / 2
- Median = 30
Conclusion
Thus, the median of the data is 30, which corresponds to option 'D'. This result aligns with the principles of symmetrical distributions, confirming that the data is balanced around this central point.

For a moderately skewed distribution, quartile deviation and the standard deviation are related by- a)S.D. = 3/2 Q.D.
- b)S.D = 3/4 Q.D.
- c)S.D. = 4/3 Q.D.
- d)S.D. = 2/3 Q.D.
Correct answer is option 'A'. Can you explain this answer?
For a moderately skewed distribution, quartile deviation and the standard deviation are related by
a)
S.D. = 3/2 Q.D.
b)
S.D = 3/4 Q.D.
c)
S.D. = 4/3 Q.D.
d)
S.D. = 2/3 Q.D.
|
|
Sushant Chaudhary answered |
The relationship between the mean, quartile and the standard deviation are as follows:
Mean Deviation is the mean of all the absolute deviations of a set of data.
Quartile deviation is the difference between “first and third quartiles” in any distribution.
Standard deviation measures the “dispersion of the data set” that is relative to its mean.
Mean Deviation = 4/5 × Quartile deviation
Standard Deviation = 3/2 × Quartile deviation
Mean deviation from the mean for the observations – 1, 0 ,4 is- a)2/3
- b)3/2
- c)2
- d)none of these
Correct answer is option 'C'. Can you explain this answer?
Mean deviation from the mean for the observations – 1, 0 ,4 is
a)
2/3
b)
3/2
c)
2
d)
none of these
|
|
Bhargavi Bose answered |
To calculate the mean deviation from the mean for a set of observations, follow these steps:
1. Calculate the mean of the observations by adding all the values together and dividing by the total number of observations.
2. Subtract the mean from each individual observation to find the deviation from the mean.
3. Take the absolute value of each deviation to ensure that negative values do not cancel out positive values.
4. Add up all the absolute deviations.
5. Divide the sum of the absolute deviations by the total number of observations to find the mean deviation from the mean.
Here is an example:
Observations: 5, 7, 9, 12, 15
1. Mean = (5 + 7 + 9 + 12 + 15) / 5 = 9.6
2. Deviations from the mean: -4.6, -2.6, -0.6, 2.4, 5.4
3. Absolute deviations: 4.6, 2.6, 0.6, 2.4, 5.4
4. Sum of absolute deviations: 15.6
5. Mean deviation from the mean = 15.6 / 5 = 3.12
Therefore, the mean deviation from the mean for these observations is 3.12.
Which one of the following average is most affected of extreme observations ?- a)Median
- b)Mode
- c)G.M.
- d)A. M.
Correct answer is option 'D'. Can you explain this answer?
Which one of the following average is most affected of extreme observations ?
a)
Median
b)
Mode
c)
G.M.
d)
A. M.
|
|
Mansi Menon answered |
Introduction:
The question asks us to identify which average is most affected by extreme observations. We have four options to choose from: Median, Mode, Geometric Mean (G.M.), and Arithmetic Mean (A.M.).
Explanation:
To determine which average is most affected by extreme observations, we need to understand how each average is calculated and how extreme observations can impact them.
Median:
The median is the middle value in a set of data when the data is arranged in ascending or descending order. If there is an odd number of observations, the median is the middle value. If there is an even number of observations, the median is the average of the two middle values.
Extreme observations have minimal impact on the median. Even if there are extremely high or low values, the median will remain relatively unchanged as long as they are not in the middle position. Therefore, we can eliminate option (a) Median as the correct answer.
Mode:
The mode is the value or values that appear most frequently in a set of data. Extreme observations have no impact on the mode unless they are the most frequently occurring values. Since extreme observations do not necessarily affect the mode, we can eliminate option (b) Mode as the correct answer.
Geometric Mean (G.M.):
The geometric mean is the nth root of the product of n numbers. Extreme observations can significantly affect the geometric mean, especially if they are large or small values. The product of extreme values will dominate the overall calculation, leading to a higher or lower geometric mean. Therefore, option (c) G.M. is also eliminated as the correct answer.
Arithmetic Mean (A.M.):
The arithmetic mean is calculated by summing all the values in a set of data and dividing by the number of observations. Extreme observations can have a significant impact on the arithmetic mean, especially if they are large or small values. Adding extreme values to the sum will increase or decrease the overall calculation, leading to a higher or lower arithmetic mean. Therefore, option (d) A.M. is the correct answer.
Conclusion:
After analyzing the impact of extreme observations on each average, we can conclude that the arithmetic mean (A.M.) is the average that is most affected by extreme observations. Extreme values have minimal impact on the median and mode, but they can significantly affect the geometric mean and arithmetic mean.
Quartile deviation is nearly equal to- a)3/2 σ
- b)2 σ
- c)2/3 σ
- d)3 σ
Correct answer is option 'C'. Can you explain this answer?
Quartile deviation is nearly equal to
a)
3/2 σ
b)
2 σ
c)
2/3 σ
d)
3 σ
|
|
EduRev JEE answered |
The quartile deviation (also called the semi-interquartile range) is approximately related to the standard deviation (σ) by the formula:

This relationship holds in cases where the data follows a normal distribution, as the quartile deviation is a measure of spread that focuses on the interquartile range.
This relationship holds in cases where the data follows a normal distribution, as the quartile deviation is a measure of spread that focuses on the interquartile range.
In a group of students, mean weight of boys is 80 kg and mean weight of girls is 50kg.If the mean weight of all the students taken together is 60kg, then the ratio of the number of boys to that of the girls is- a)2 : 1
- b)3 : 2
- c)1 : 2
- d)2 : 3
Correct answer is option 'C'. Can you explain this answer?
In a group of students, mean weight of boys is 80 kg and mean weight of girls is 50kg.If the mean weight of all the students taken together is 60kg, then the ratio of the number of boys to that of the girls is
a)
2 : 1
b)
3 : 2
c)
1 : 2
d)
2 : 3
|
|
Nipuns Institute answered |
To solve this, let the number of boys be b and the number of girls be g.
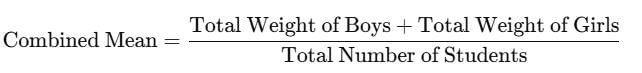
Step 1: Use the formula for the combined mean
The formula for the mean of a combined group is:
Given: Mean weight of boys = 80kg,
Mean weight of girls = 50kg,
Combined mean = 60kg.
The total weight of boys is 80b, and the total weight of girls is 50g. The total number of students is b+g. Substituting these into the formula:

Step 2: Solve for the ratio b/g
Multiply through by b+g to eliminate the denominator:
60(b+g)=80b+50g
Expand and simplify:
60b+60g=80b+50g
60g−50g=80b−60b
10g=20b
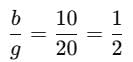
Step 3: Conclusion
The ratio of the number of boys to the number of girls is:
1:2
Step 1: Use the formula for the combined mean
The formula for the mean of a combined group is:
Given: Mean weight of boys = 80kg,
Mean weight of girls = 50kg,
Combined mean = 60kg.
The total weight of boys is 80b, and the total weight of girls is 50g. The total number of students is b+g. Substituting these into the formula:
Step 2: Solve for the ratio b/g
Multiply through by b+g to eliminate the denominator:
60(b+g)=80b+50g
Expand and simplify:
60b+60g=80b+50g
60g−50g=80b−60b
10g=20b
Step 3: Conclusion
The ratio of the number of boys to the number of girls is:
1:2
If the mean of 3,4,x,7,10, is 6, then the value of x is- a)7
- b)5
- c)4
- d)6
Correct answer is option 'D'. Can you explain this answer?
If the mean of 3,4,x,7,10, is 6, then the value of x is
a)
7
b)
5
c)
4
d)
6
|
|
Tanishq Singh answered |
Question:
If the mean of 3, 4, x, 7, 10 is 6, then the value of x is
Answer:
To find the value of x, we need to use the formula for the mean, which is the sum of all the numbers divided by the total number of numbers.
The formula for the mean is:
mean = (3 + 4 + x + 7 + 10)/5
Given that the mean is 6, we can substitute this value into the formula and solve for x:
6 = (3 + 4 + x + 7 + 10)/5
Simplifying the equation:
To simplify the equation, we can start by multiplying both sides of the equation by 5 to eliminate the fraction:
6 * 5 = (3 + 4 + x + 7 + 10)
30 = 3 + 4 + x + 7 + 10
Now, we can combine like terms on the right side of the equation:
30 = 24 + x
Next, we can isolate the variable x by subtracting 24 from both sides of the equation:
30 - 24 = x
6 = x
Conclusion:
Therefore, the value of x is 6. Hence, the correct answer is option D.
S.D. of a data is 6. When each observation is increased by 1, then the S.D. of new data is- a)8
- b)6
- c)5
- d)7
Correct answer is option 'B'. Can you explain this answer?
S.D. of a data is 6. When each observation is increased by 1, then the S.D. of new data is
a)
8
b)
6
c)
5
d)
7
|
|
EduRev JEE answered |
Answer: B: 6
Explanation: When a constant is added to every observation in a data set, the spread or dispersion of the data does not change. Therefore, adding 1 to each observation leaves the standard deviation unchanged.
If the angle between two lines of regression is 900, then it represents- a)no linear correlation
- b)perfect positive correlation
- c)perfect negative correlation
- d)none of these
Correct answer is option 'A'. Can you explain this answer?
If the angle between two lines of regression is 900, then it represents
a)
no linear correlation
b)
perfect positive correlation
c)
perfect negative correlation
d)
none of these
|
|
Disha Bajaj answered |
Explanation:
When we talk about the angle between two lines of regression, we are referring to the angle between the regression lines of two variables in a scatter plot. The regression line represents the best fit line that minimizes the sum of squared residuals.
No Linear Correlation:
If the angle between the two lines of regression is 90°, it indicates that there is no linear correlation between the variables. In other words, the variables are not related to each other in a linear manner. This can happen when the data points are scattered randomly and do not follow any clear pattern or trend.
Perfect Positive Correlation:
If the angle between the two lines of regression is 0°, it represents a perfect positive correlation between the variables. This means that as one variable increases, the other variable also increases in a linear manner. The data points lie close to the regression line, indicating a strong positive relationship.
Perfect Negative Correlation:
If the angle between the two lines of regression is 180°, it represents a perfect negative correlation between the variables. This means that as one variable increases, the other variable decreases in a linear manner. The data points lie close to the regression line, indicating a strong negative relationship.
Explanation of the Correct Answer:
In this case, the angle between the two lines of regression is given as 90°. Since the angle is not 0° (perfect positive correlation) or 180° (perfect negative correlation), it indicates that there is no linear correlation between the variables. The data points are scattered randomly, and there is no clear relationship between them.
Therefore, the correct answer is option 'A' - no linear correlation.
If COV(X,Y) = 0, then the two lines of the regression are- a)parallel
- b)coincident
- c)at right angles
- d)none of these
Correct answer is option 'C'. Can you explain this answer?
If COV(X,Y) = 0, then the two lines of the regression are
a)
parallel
b)
coincident
c)
at right angles
d)
none of these
|
|
Learners Habitat answered |
If COV(X,Y)=0, it implies that the covariance between X and Y is zero. This means that there is no linear relationship between the two variables. In such a case, the correlation coefficient ρ(X,Y)=0, and the two lines of regression will be at right angles to each other.
If the two lines of regression are y = 3x – 5 and y = 2x – 4 , then ρ(X,Y) is equal t- a)

- b)

- c)

- d)none of these
Correct answer is option 'C'. Can you explain this answer?
If the two lines of regression are y = 3x – 5 and y = 2x – 4 , then ρ(X,Y) is equal t
a)
b)
c)
d)
none of these
|
|
Tarun Kaushik answered |
To determine the correlation coefficient ρ(X,Y) from the two regression lines, we use the property that the product of the slopes of the two regression lines is equal to ρ 2 .
Given regression lines:
y=3x−5
Slope (m1 ) = 3
Given regression lines:
y=3x−5
Slope (m1 ) = 3
y=2x−4
Slope ( m2) = 2
Step 1: Check the product of slopes
The product of the slopes of the regression lines is:
m 1 ⋅m 2 =3⋅2=6
However, for the two regression lines, the product of their slopes must satisfy:
m1 ⋅m2 =ρ 2
Thus: ρ2 =6
Step 2: Conclusion
Since ρ2 cannot exceed 1, this configuration of regression lines is not possible. Hence, ρ(X,Y) is undefined for the given regression lines.
Which of the following, in case of a discrete data, is not equal to the median?- a)5th decile
- b)2nd quartile
- c)lower quartile
- d)50th percentile
Correct answer is option 'C'. Can you explain this answer?
Which of the following, in case of a discrete data, is not equal to the median?
a)
5th decile
b)
2nd quartile
c)
lower quartile
d)
50th percentile

|
KP Classes answered |
The median is the middle value of a dataset when arranged in ascending order. It is also represented as:
- The 5th decile (because the median divides the data into two equal parts, which is the 5th decile in the decile system).
- The 2nd quartile (as quartiles divide the data into four equal parts, and the median is at the 2nd quartile).
- The 50th percentile (since percentiles divide the data into 100 equal parts, and the median corresponds to the 50th percentile).
The lower quartile (Q1) is the first quartile, representing the 25th percentile, and is not equal to the median.
For a bivariate frequency distribution byx > 1, then byx is- a)negative
- b)less than 1
- c)lies between 0 and 1
- d)none of these
Correct answer is option 'D'. Can you explain this answer?
For a bivariate frequency distribution byx > 1, then byx is
a)
negative
b)
less than 1
c)
lies between 0 and 1
d)
none of these
|
|
KP Classes answered |
The regression coefficient b yx is defined as the change in Y per unit change in X. It is related to the correlation coefficient ρ(X,Y) and the regression coefficient b xy through the relationship:
byx⋅bxy=ρ2
Where ρ is the correlation coefficient, and ρ2 lies between 0 and 1.
Key Consideration: If byx >1, it means that the slope of the regression line predicting Y from X is greater than 1. However, b yx can still be positive or negative depending on the direction of the relationship.
The condition b yx >1 implies a steeper slope of the regression line for Y on X. It does not necessarily indicate negativity or positivity, as it depends on the data.
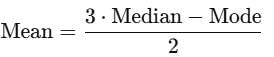
If mean = (3 median – mode) x , then the value of x is- a)1
- b)1/2
- c)3/2
- d)2
Correct answer is option 'B'. Can you explain this answer?
If mean = (3 median – mode) x , then the value of x is
a)
1
b)
1/2
c)
3/2
d)
2

|
Nipun Tuteja answered |
We are given the relationship:
Mean=(3⋅Median−Mode)⋅x
Step 1: Recall the empirical relationship
The empirical relationship between the mean, median, and mode is:
Mode=3⋅Median−2⋅Mean
Step 2: Compare the given formula with the empirical relationship
Rewriting the empirical formula for the mean:
Compare this with the given formula:
Mean=(3⋅Median−Mode)⋅x
Equating the two expressions for the mean:
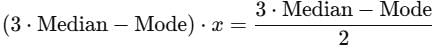
Step 3: Solve for x
Cancel
3⋅Median−Mode (non-zero):

Mean=(3⋅Median−Mode)⋅x
Step 1: Recall the empirical relationship
The empirical relationship between the mean, median, and mode is:
Mode=3⋅Median−2⋅Mean
Step 2: Compare the given formula with the empirical relationship
Rewriting the empirical formula for the mean:
Compare this with the given formula:
Mean=(3⋅Median−Mode)⋅x
Equating the two expressions for the mean:
Step 3: Solve for x
Cancel
3⋅Median−Mode (non-zero):
A group of 10 items has mean 6. If the mean of 4 of these items is 7.5, then the mean of the remaining items is- a)5.5
- b)5.0
- c)6.5
- d)4.5
Correct answer is option 'B'. Can you explain this answer?
A group of 10 items has mean 6. If the mean of 4 of these items is 7.5, then the mean of the remaining items is
a)
5.5
b)
5.0
c)
6.5
d)
4.5

|
Anand Khanna answered |
Total of 10 items = 6 x 10 =60
Total of 4 items = 4 x 7.5 =30
=> Total of remaining 6 items = 60−30 =30
Mean = 306 =5
Ans : (B)
The mean and S.D. of 1,2,3,4,5,6 is- a)3,3
- b)7/2,√3
- c)7/2,

- d)3, 35/12
Correct answer is option 'C'. Can you explain this answer?
The mean and S.D. of 1,2,3,4,5,6 is
a)
3,3
b)
7/2,√3
c)
7/2,
d)
3, 35/12
|
|
Learners Habitat answered |
We are given the data: 1, 2, 3, 4, 5, 6
Step 1: Calculate the Mean
The formula for the mean is:
Mean = (Sum of all values) / (Number of values)
Substituting the values:
Mean = (1 + 2 + 3 + 4 + 5 + 6) / 6 = 21 / 6 = 7/2
Step 2: Calculate the Variance
The formula for variance is:
Variance = Σ(xi - Mean)² / n
1. Subtract the mean (7/2) from each value and square the result:
- (1 - 7/2)² = (-5/2)² = 25/4
- (2 - 7/2)² = (-3/2)² = 9/4
- (3 - 7/2)² = (-1/2)² = 1/4
- (4 - 7/2)² = (1/2)² = 1/4
- (5 - 7/2)² = (3/2)² = 9/4
- (6 - 7/2)² = (5/2)² = 25/4
2. Sum the squared values:
(25/4) + (9/4) + (1/4) + (1/4) + (9/4) + (25/4) = 70/4 = 35/2
3. Divide by n (6):
Variance = (35/2) / 6 = 35/12
Step 3: Calculate the Standard Deviation
The standard deviation is the square root of the variance:
Standard Deviation = √(35/12)
Final Answer
The mean is 7/2, and the standard deviation is √(35/12).
Correct option: (c) 7/2, √(35/12)
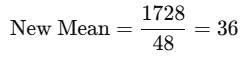
The mean of 50 observations is 36, if two observations are 30 and 42 are deleted , then the mean of the remaining observations is- a)36
- b)48
- c)38
- d)46
Correct answer is option 'A'. Can you explain this answer?
The mean of 50 observations is 36, if two observations are 30 and 42 are deleted , then the mean of the remaining observations is
a)
36
b)
48
c)
38
d)
46
|
|
Learners Habitat answered |
Step 1: Calculate the total sum of the observations
The mean of 50 observations is 36. Therefore, the total sum of the 50 observations is: Total Sum = Mean × Number of Observations
Total Sum=Mean×Number of Observations
Total Sum = 36 × 50 = 1800 Total Sum=36×50=1800
Step 2: Subtract the deleted observations
Two observations, 30 and 42, are deleted. The sum of these two observations is: Sum of deleted observations = 30 + 42 = 72
Sum of deleted observations=30+42=72
The new total sum of the remaining observations is:
New Total Sum = 1800 − 72 = 1728 New Total Sum=1800−72=1728
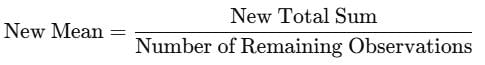
Step 3: Calculate the mean of the remaining observations
The number of remaining observations is:
50 − 2 = 48 50−2=48
The new mean is:
50−2=48
The new mean is:
The mean of 50 observations is 36. Therefore, the total sum of the 50 observations is: Total Sum = Mean × Number of Observations
Total Sum=Mean×Number of Observations
Total Sum = 36 × 50 = 1800 Total Sum=36×50=1800
Step 2: Subtract the deleted observations
Two observations, 30 and 42, are deleted. The sum of these two observations is: Sum of deleted observations = 30 + 42 = 72
Sum of deleted observations=30+42=72
The new total sum of the remaining observations is:
New Total Sum = 1800 − 72 = 1728 New Total Sum=1800−72=1728
Step 3: Calculate the mean of the remaining observations
The number of remaining observations is:
50 − 2 = 48 50−2=48
The new mean is:
50−2=48
The new mean is:
If the variance of the data is V, then its S.D. is- a)

- b)V2
- c)±
- d)-
Correct answer is option 'A'. Can you explain this answer?
If the variance of the data is V, then its S.D. is
a)
b)
V2
c)
±
d)
-

|
Foothill Academy answered |
If the variance of the data is denoted by V, then the standard deviation (S.D.) is the square root of the variance.
Mathematically,
S.D. = √V
The correct answer is: a) √V
Mathematically,
S.D. = √V
The correct answer is: a) √V
The most stable measure of central tendency is- a)mean
- b)mode
- c)median
- d)none of these
Correct answer is option 'A'. Can you explain this answer?
The most stable measure of central tendency is
a)
mean
b)
mode
c)
median
d)
none of these
|
|
Learners Habitat answered |
Answer: A: mean
Explanation: The mean is considered the most stable measure of central tendency because it takes into account every value in the data set. This results in it having a lower sampling variability compared to the median or mode, especially as the sample size increases.
The median of the data 13,14,16,18,20,22 is- a)16
- b)19
- c)18
- d)17
Correct answer is option 'D'. Can you explain this answer?
The median of the data 13,14,16,18,20,22 is
a)
16
b)
19
c)
18
d)
17
|
|
Nipun Tuteja answered |
To find the median, we first arrange the data in ascending order (already done here):
13,14,16,18,20,22
Step 1: Count the number of observations
The number of data points is �� = 6 n=6 (even).
Step 2: Median for even n
For an even number of observations, the median is the average of the two middle values. The two middle values here are 16 and 18.

13,14,16,18,20,22
Step 1: Count the number of observations
The number of data points is �� = 6 n=6 (even).
Step 2: Median for even n
For an even number of observations, the median is the average of the two middle values. The two middle values here are 16 and 18.
The range of the following set of observations 2,3,5,9,8,7,6,5,7,4,3 is- a)5.5
- b)7
- c)6
- d)11
Correct answer is option 'B'. Can you explain this answer?
The range of the following set of observations 2,3,5,9,8,7,6,5,7,4,3 is
a)
5.5
b)
7
c)
6
d)
11
|
|
Nipun Tuteja answered |
Step 1: Definition of Range
The range of a dataset is the difference between the maximum and minimum values.
Step 2: Identify Maximum and Minimum Values
From the given dataset:
2,3,5,9,8,7,6,5,7,4,3
The range of a dataset is the difference between the maximum and minimum values.
Step 2: Identify Maximum and Minimum Values
From the given dataset:
2,3,5,9,8,7,6,5,7,4,3
- Maximum value: 9
- Minimum value: 2
Step 3: Calculate the Range
Range=Maximum−Minimum=9−2=7
Range=Maximum−Minimum=9−2=7
Which of the following is not a measure of dispersion ?- a)mean
- b)mean deviation
- c)variance
- d)range
Correct answer is option 'A'. Can you explain this answer?
Which of the following is not a measure of dispersion ?
a)
mean
b)
mean deviation
c)
variance
d)
range
|
|
Nipun Tuteja answered |
A measure of dispersion quantifies the spread or variability of a dataset. Common measures of dispersion include:
- Mean deviation: Measures the average distance of data points from the mean or median.
- Variance: Measures the average squared deviation from the mean.
- Range: Measures the difference between the maximum and minimum values.
The mean, however, is a measure of central tendency, not dispersion.
Chapter doubts & questions for Statistics - Mathematics for JAMB 2025 is part of JAMB exam preparation. The chapters have been prepared according to the JAMB exam syllabus. The Chapter doubts & questions, notes, tests & MCQs are made for JAMB 2025 Exam. Find important definitions, questions, notes, meanings, examples, exercises, MCQs and online tests here.
Chapter doubts & questions of Statistics - Mathematics for JAMB in English & Hindi are available as part of JAMB exam.
Download more important topics, notes, lectures and mock test series for JAMB Exam by signing up for free.
Mathematics for JAMB
134 videos|94 docs|102 tests
|
|
© EduRev
|
Education Revolution
|


|


Signup on EduRev and stay on top of your study goals
10M+ students crushing their study goals daily