


All Exams >
Grade 7 >
Mathematics for Grade 7 >
All Questions
All questions of Data Handling for Grade 7 Exam
There are 2 red, 3 blue and 5 black balls in a bag. A ball is drawn from the bag without looking in to the bag. What is the probability of getting a red ball?- a)1/5
- b)2/5
- c)3/5
- d)None of these
Correct answer is option 'A'. Can you explain this answer?
There are 2 red, 3 blue and 5 black balls in a bag. A ball is drawn from the bag without looking in to the bag. What is the probability of getting a red ball?
a)
1/5
b)
2/5
c)
3/5
d)
None of these
|
|
Amit Sharma answered |
Total number of outcomes = 10
No. of favourable outcomes = 2 red balls
Probability of red balls = No. of favourable outcomes/Total number of outcomes
= 2/10= 1/5
No. of favourable outcomes = 2 red balls
Probability of red balls = No. of favourable outcomes/Total number of outcomes
= 2/10= 1/5

The number of times an observation occurs in a data is called its
- a)Range
- b)Raw data
- c)Interval
- d)Frequency
Correct answer is option 'D'. Can you explain this answer?
The number of times an observation occurs in a data is called its
a)
Range
b)
Raw data
c)
Interval
d)
Frequency

|
Ishaan Chatterjee answered |
Explanation of Terms:
-
Frequency: The count of how many times a specific data point or value appears in a dataset. For example, if the number 5 appears 10 times in a dataset, the frequency of the number 5 is 10.
-
Range: The difference between the highest and lowest values in a dataset. For example, if the highest value is 20 and the lowest is 5, the range is 20 - 5 = 15.
-
Raw Data: The original, unprocessed data collected from observations or measurements before any analysis or summary is done.
-
Interval: In statistics, intervals are ranges of values within which data points fall. For example, if data is grouped into intervals like 10-20, 21-30, etc., each interval represents a range of values.
So, frequency is the term used to describe how many times a particular observation appears in a dataset.
There are 2 red, 3 blue and 5 black balls in a bag. A ball is drawn from the bag without looking in to the bag. What is the probability of getting a non-red ball?- a)4/5
- b)2/5
- c)3/5
- d)None of these
Correct answer is option 'A'. Can you explain this answer?
There are 2 red, 3 blue and 5 black balls in a bag. A ball is drawn from the bag without looking in to the bag. What is the probability of getting a non-red ball?
a)
4/5
b)
2/5
c)
3/5
d)
None of these

|
Shiksha Academy answered |
As we can see in the bar graph , Sharanya and Shravan have secured the same marks.
There are 2 red, 3 blue and 5 black balls in a bag. A ball is drawn from the bag without looking in to the bag. What is the probability of getting a blue ball?- a)3/10
- b)3/5
- c)2/5
- d)None of these
Correct answer is option 'A'. Can you explain this answer?
There are 2 red, 3 blue and 5 black balls in a bag. A ball is drawn from the bag without looking in to the bag. What is the probability of getting a blue ball?
a)
3/10
b)
3/5
c)
2/5
d)
None of these

|
Gunjan Lakhani answered |
total number of outcomes = 10
favourable(getting a blue ball) = 3
Probability(getting a blue ball) = 3/10
favourable(getting a blue ball) = 3
Probability(getting a blue ball) = 3/10

Find the mean weight of the data set shown. 5 kg, 43 kg, 18 kg, 26 kg, 28 kg, 46 kg, 41 kg, 1 kg- a)28 kg
- b)30 kg
- c)26 Kg
- d)27 Kg
Correct answer is option 'C'. Can you explain this answer?
Find the mean weight of the data set shown. 5 kg, 43 kg, 18 kg, 26 kg, 28 kg, 46 kg, 41 kg, 1 kg
a)
28 kg
b)
30 kg
c)
26 Kg
d)
27 Kg
|
|
Priyanka Sharma answered |
Mean = Sum of mass weights / Total number of weighs
= (5 + 43 + 18 + 26 + 28 + 46 + 41 + 1)/8
= 26
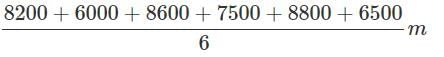
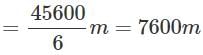
The heights of six mountains are 8200 m, 6000 m, 8600 m, 7500 m, 8800 m and 6500 m. Based on this information, answer the questions given.
Q. What is the approximate average height of the mountains?- a)7657m
- b)7600m
- c)7756m
- d)7765m
Correct answer is option 'B'. Can you explain this answer?
The heights of six mountains are 8200 m, 6000 m, 8600 m, 7500 m, 8800 m and 6500 m. Based on this information, answer the questions given.
Q. What is the approximate average height of the mountains?
Q. What is the approximate average height of the mountains?
a)
7657m
b)
7600m
c)
7756m
d)
7765m

|
Madhurima Kulkarni answered |
Average height of the mountains
=
=
When a coin is thrown, total number of possible outcomes is ______.- a)5
- b)2
- c)6
- d)None of these
Correct answer is option 'B'. Can you explain this answer?
When a coin is thrown, total number of possible outcomes is ______.
a)
5
b)
2
c)
6
d)
None of these

|
Rainbow Rise Classes answered |
The first five prime numbers are 2, 3, 5, 7 and 11.
∴Their mean =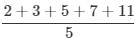 = 5.6
= 5.6
∴Their mean =
= 5.6A kennel can accommodate 12 dogs that weigh (in pounds) 6, 14, 23, 17, 19, 27, 39, 7, 33, 4, 11, and 13. Find the range of their weights.- a)39 pounds
- b)35 pounds
- c)37 pounds
- d)none of these
Correct answer is option 'B'. Can you explain this answer?
A kennel can accommodate 12 dogs that weigh (in pounds) 6, 14, 23, 17, 19, 27, 39, 7, 33, 4, 11, and 13. Find the range of their weights.
a)
39 pounds
b)
35 pounds
c)
37 pounds
d)
none of these
|
|
Anagha Basu answered |
The Range is the difference between the lowest and highest values.
Here the highest value is 39 and the lowest value is 4
So Range = Highest Value - Lowest Value
= 39 - 4 = 35
So option B is the correct answer.
Two dice are thrown, find and number of outcomes.- a)12
- b)6
- c)36
- d)None of thes
Correct answer is option 'C'. Can you explain this answer?
Two dice are thrown, find and number of outcomes.
a)
12
b)
6
c)
36
d)
None of thes
|
|
Ananya Das answered |
Since two dice are thrown simultaneously total numbers of outcomes are 6*6=36 . We make pairs of it
(1,1) (2,1) (3,1).....(6,1)
: : : ::::: :
(1,6) (2,6) (3,6).....(6,6)
(1,1) (2,1) (3,1).....(6,1)
: : : ::::: :
(1,6) (2,6) (3,6).....(6,6)
Can you explain the answer of this question below:When a die is thrown, total number of possible outcomes is ______.
- A:
2
- B:
6
- C:
36
- D:
None of these
The answer is B.
When a die is thrown, total number of possible outcomes is ______.
2
6
36
None of these
|
|
Uday Verma answered |
Explanation:
When a die is thrown, it can land with any one of its six faces up. Therefore, the total number of possible outcomes is 6.
Answer:
Option b) 6
When a die is thrown, it can land with any one of its six faces up. Therefore, the total number of possible outcomes is 6.
Answer:
Option b) 6
What is the arithmetic mean of 1, 2,3,4,5,6,7,8, 9 and 10?
- a)5.5
- b)6
- c)7.5
- d)10
Correct answer is option 'A'. Can you explain this answer?
What is the arithmetic mean of 1, 2,3,4,5,6,7,8, 9 and 10?
a)
5.5
b)
6
c)
7.5
d)
10

|
Arindam Kumar answered |
Solution:
-
Add all the numbers: 1 + 2 + 3 + 4 + 5 + 6 + 7 + 8 + 9 + 10 = 55
-
Count the total number of numbers: There are 10 numbers.
-
Divide the sum by the total number of numbers: Arithmetic mean = 55 / 10 = 5.5
Therefore, the arithmetic mean of 1, 2, ..., 9, and 10 is 5.5.
Shortcut for Finding the Mean of Consecutive Numbers
For a series of consecutive numbers, the arithmetic mean is simply the average of the first and last number.
In this case, the numbers are consecutive from 1 to 10.
- First number: 1
- Last number: 10
Mean = (First number + Last number) / 2 = (1 + 10) / 2 = 11 / 2 = 5.5
Therefore, the arithmetic mean of 1, 2, ..., 9, and 10 is 5.5.
This shortcut works because the numbers are evenly spaced.
There are 2 red, 3 blue and 5 black balls in a bag. A ball is drawn from the bag without looking in to the bag. What is the probability of getting a non-blue ball?- a)3/5
- b)7/10
- c)2/5
- d)None of these
Correct answer is option 'B'. Can you explain this answer?
There are 2 red, 3 blue and 5 black balls in a bag. A ball is drawn from the bag without looking in to the bag. What is the probability of getting a non-blue ball?
a)
3/5
b)
7/10
c)
2/5
d)
None of these

|
Learning Enablers answered |
total number of outcomes = 10
favourable(not getting a blue ball) = 7
Probability(not getting a blue ball) = 7/10
favourable(not getting a blue ball) = 7
Probability(not getting a blue ball) = 7/10
The ages (in years) of some teachers of a school are given in the box. 26, 32,38, 41,26, 31, 35,33,26,37 Based on this information, answer the following questions.
Q. What is the mean age of the teachers?
- a)23.5 years
- b)32.5 years
- c)35 years
- d)38 years
Correct answer is option 'B'. Can you explain this answer?
The ages (in years) of some teachers of a school are given in the box. 26, 32,38, 41,26, 31, 35,33,26,37 Based on this information, answer the following questions.
Q. What is the mean age of the teachers?
Q. What is the mean age of the teachers?
a)
23.5 years
b)
32.5 years
c)
35 years
d)
38 years

|
Keerthana Mukherjee answered |
Mean = 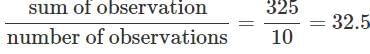 years.
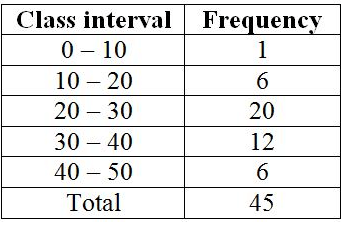
years.What is the size of the class interval?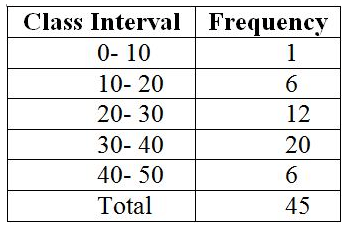
- a)15
- b)5
- c)20
- d)10
Correct answer is option 'D'. Can you explain this answer?
What is the size of the class interval?
a)
15
b)
5
c)
20
d)
10

|
Praveen Kumar answered |
Mean of first 5 natural numbers = 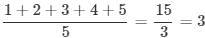 Median of 1,2,◯3,4,5,=3
Median of 1,2,◯3,4,5,=3The average weight of a sample of 10 apples is 52 g. Later it was found that the weighing machine had shown the weight of each apple 10 g less. What is the correct average weight of an apple?- a)62 g
- b)54 g
- c)56 g
- d)52 g
Correct answer is option 'A'. Can you explain this answer?
The average weight of a sample of 10 apples is 52 g. Later it was found that the weighing machine had shown the weight of each apple 10 g less. What is the correct average weight of an apple?
a)
62 g
b)
54 g
c)
56 g
d)
52 g
|
|
Lavanya Menon answered |
Since every apple has now 10g more, the average will rise by 10g, So accurate average= 52+10=62g
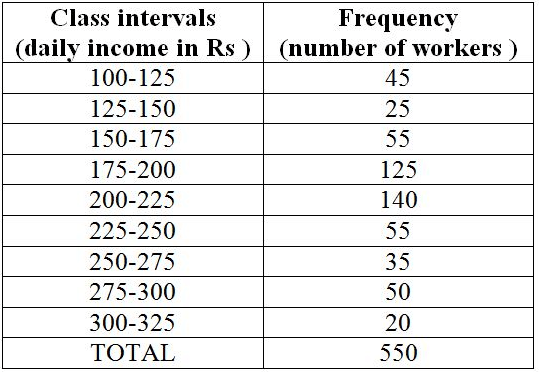
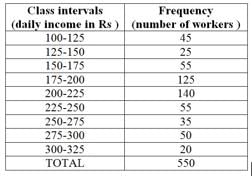
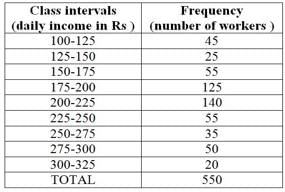
What is the frequency of class interval 300-325?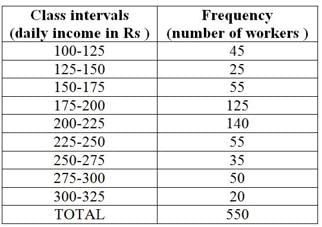
- a)50
- b)20
- c)25
- d)None of these
Correct answer is option 'B'. Can you explain this answer?
What is the frequency of class interval 300-325?
a)
50
b)
20
c)
25
d)
None of these
|
|
MEHAK MAHESHWARI ❤ answered |
Areww isme explain kya krna look at the table ... and answer it..

Which two classes have the same frequency?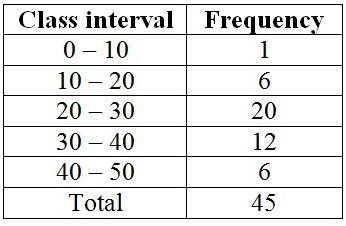
- a)20 – 30 and 40 – 50
- b)10 – 20 and 20 – 30
- c)10 – 20 and 40 – 50
- d)none of these
Correct answer is option 'C'. Can you explain this answer?
Which two classes have the same frequency?
a)
20 – 30 and 40 – 50
b)
10 – 20 and 20 – 30
c)
10 – 20 and 40 – 50
d)
none of these

|
Anish Kumar answered |
Because. frequency is equal given in the graph
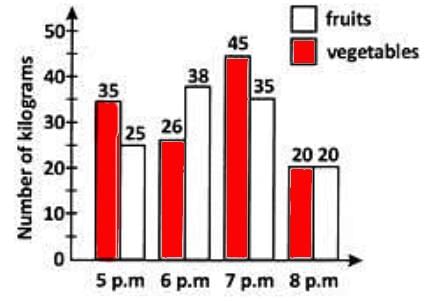
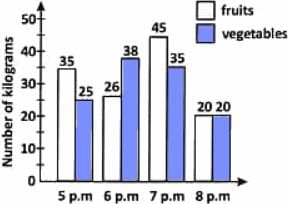
Direction: The bar graph shows the sales of fruits and vegetables in a store in 4 hours on a certain evening.
Sales of fruits and vegetables in a store
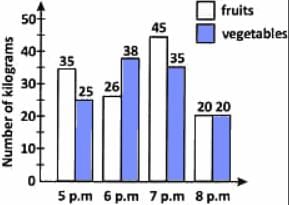
How many kilograms of fruits were sold during the four hours?
- a)120 kg
- b)124 kg
- c)126 kg
- d)144 kg
Correct answer is option 'C'. Can you explain this answer?
Direction: The bar graph shows the sales of fruits and vegetables in a store in 4 hours on a certain evening.
Sales of fruits and vegetables in a store
How many kilograms of fruits were sold during the four hours?
Sales of fruits and vegetables in a store
How many kilograms of fruits were sold during the four hours?
a)
120 kg
b)
124 kg
c)
126 kg
d)
144 kg

|
Purohit Nita answered |
C
The arithmetic mean of five given numbers is 85. What is their sum?- a)425
- b)85
- c)A number between 85 and 425.
- d)A number greater than 500.
Correct answer is option 'A'. Can you explain this answer?
The arithmetic mean of five given numbers is 85. What is their sum?
a)
425
b)
85
c)
A number between 85 and 425.
d)
A number greater than 500.
|
|
Nisha dubey answered |
arithmetic mean = sum of observation / total no of observation
therefore;
sum of observation = arithmetic mean x total no of observation
sum of observation = 85 X 5=425
Direction: The bar graph shows the sales of fruits and vegetables in a store in 4 hours on a certain evening.
Sales of fruits and vegetables in a store
During the four hours, which of the following is true about the sale of fruits and vegetables?
- a)The sale of vegetables was lesser than that of fruits.
- b)The sale of fruits is 120 kg.
- c)The sale of vegetables is 126 kg.
- d)none
Correct answer is option 'C'. Can you explain this answer?
Direction: The bar graph shows the sales of fruits and vegetables in a store in 4 hours on a certain evening.
Sales of fruits and vegetables in a store
During the four hours, which of the following is true about the sale of fruits and vegetables?
Sales of fruits and vegetables in a store
During the four hours, which of the following is true about the sale of fruits and vegetables?
a)
The sale of vegetables was lesser than that of fruits.
b)
The sale of fruits is 120 kg.
c)
The sale of vegetables is 126 kg.
d)
none

|
Subset Academy answered |
- No. of kilograms of-fruits sold during the four hours =35+26+45+20=126.
Find the mode for the data set, which shows the heights (in inches) of 10 students of Piyush’s class. 65, 60, 64, 61, 66, 67, 67, 67, 62, 77- a)60
- b)67
- c)66
- d)None of these
Correct answer is option 'B'. Can you explain this answer?
Find the mode for the data set, which shows the heights (in inches) of 10 students of Piyush’s class. 65, 60, 64, 61, 66, 67, 67, 67, 62, 77
a)
60
b)
67
c)
66
d)
None of these
|
|
Varun Kapoor answered |
the mode of a set of numbers is the number that appears most often in the set.
Since the number 67 appears the most . So the mode of the given data is 67.
So option B is the correct answer.
There are 2 red, 3 blue and 5 black balls in a bag. A ball is drawn from the bag without looking in to the bag. What is the probability of getting a black ball?- a)2/5
- b)3/5
- c)1/2
- d)None of these
Correct answer is option 'C'. Can you explain this answer?
There are 2 red, 3 blue and 5 black balls in a bag. A ball is drawn from the bag without looking in to the bag. What is the probability of getting a black ball?
a)
2/5
b)
3/5
c)
1/2
d)
None of these
|
|
Yogita Iyer answered |
Problem:
There are 2 red, 3 blue, and 5 black balls in a bag. A ball is drawn from the bag without looking into the bag. What is the probability of getting a black ball?
Solution:
To find the probability of drawing a black ball, we need to calculate the number of favorable outcomes (drawing a black ball) and divide it by the number of possible outcomes (drawing any ball).
Step 1: Identify the Favorable Outcomes:
The favorable outcome in this case is drawing a black ball. There are 5 black balls in the bag.
Step 2: Identify the Possible Outcomes:
The possible outcomes are drawing any ball from the bag. Since there are 2 red, 3 blue, and 5 black balls in total, the number of possible outcomes is 2 + 3 + 5 = 10.
Step 3: Calculate the Probability:
The probability of an event is calculated by dividing the number of favorable outcomes by the number of possible outcomes.
Probability of drawing a black ball = (Number of favorable outcomes) / (Number of possible outcomes)
= 5 / 10
= 1/2
Therefore, the probability of drawing a black ball from the bag is 1/2 or 0.5.
Answer:
The correct answer is option C) 1/2.
Which of the following is true about mean?- a)It occurs most frequently.
- b)It divides observations into two equal parts.
- c)It is representative of the whole group.
- d)It is the sum of observations.
Correct answer is option 'C'. Can you explain this answer?
Which of the following is true about mean?
a)
It occurs most frequently.
b)
It divides observations into two equal parts.
c)
It is representative of the whole group.
d)
It is the sum of observations.

|
Nidhi Nair answered |
Mean is representative of whole group.
The median of distribution 9, 3, 4, 7, 5, 1, 8 is:- a)4
- b)5
- c)1
- d)9
Correct answer is option 'B'. Can you explain this answer?
The median of distribution 9, 3, 4, 7, 5, 1, 8 is:
a)
4
b)
5
c)
1
d)
9

|
Aim It Academy answered |
Arranging the terms in ascending order 1, 3, 4, 5, 7, 8, 9
The median is the middle observation.
Therefore 5 is the median.
There are 2 red, 3 blue and 5 black balls in a bag. A ball is drawn from the bag without looking in to the bag. What is the probability of getting a non-black ball?a)None of theseb)3/5c)2/5d)1/2Correct answer is option 'D'. Can you explain this answer?
|
|
Shradha verma answered |
The correct answer is d
No of red balls are 2.
The probability of getting a red ball is=no of favorable outcomes/total outcomes.
Here,
Total outcomes are=2+3+5=10
So,
Probability of getting a red ball is = 2/10= 1/5
The heights of six mountains are 8200 m, 6000 m, 8600 m, 7500 m, 8800 m and 6500 m. Based on this information, answer the questions given. Find the median height of the mountains.- a)7850m
- b)7580m
- c)8750m
- d)5780m
Correct answer is option 'A'. Can you explain this answer?
The heights of six mountains are 8200 m, 6000 m, 8600 m, 7500 m, 8800 m and 6500 m. Based on this information, answer the questions given. Find the median height of the mountains.
a)
7850m
b)
7580m
c)
8750m
d)
5780m
|
|
Gunjan Lakhani answered |
To find the median height, first arrange the heights in ascending order:
6000 m, 6500 m, 7500 m, 8200 m, 8600 m, 8800 m.
Since there are six values, the median is the average of the 3rd and 4th values:
(7500 + 8200) / 2 = 7850 m.
Which student scored the highest marks?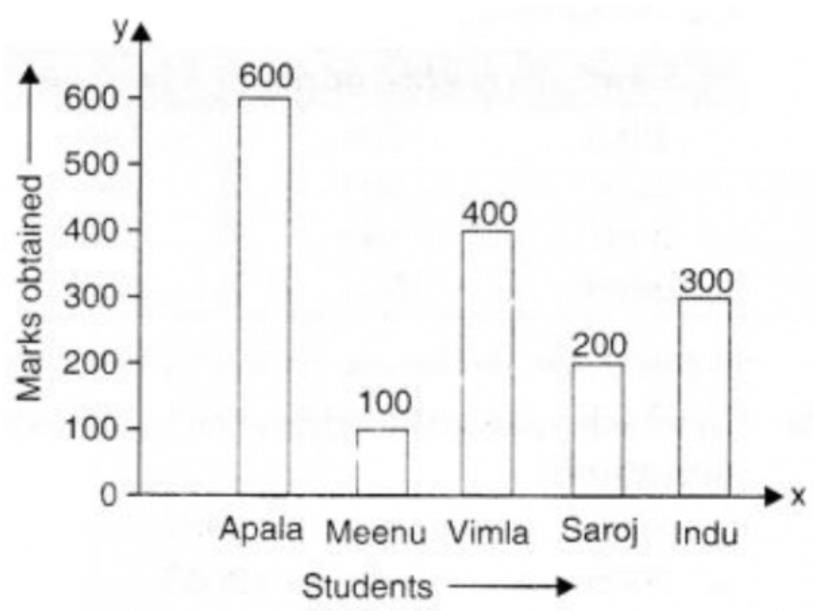
- a)Meenu
- b)Vimla
- c)Apala
- d)Saroj
Correct answer is option 'C'. Can you explain this answer?
Which student scored the highest marks?
a)
Meenu
b)
Vimla
c)
Apala
d)
Saroj
|
|
Sannidhya Naskar answered |
As we can see clearly that in the given bar graph we can see the marks of five students there marks are and the highest value given in the bar graph is 600. So there marks are
Apala =600
Meenu= 100
Vimal = 400
Saroj = 200
Indu = 300
Now arranging them in ascending order
= 100< />< />< />< />
= Mennu< />< />< />< apala="" />
So Therefore it is concluded that Apala marks is higer than all
So the answer is option c) Apala
Apala =600
Meenu= 100
Vimal = 400
Saroj = 200
Indu = 300
Now arranging them in ascending order
= 100< />< />< />< />
= Mennu< />< />< />< apala="" />
So Therefore it is concluded that Apala marks is higer than all
So the answer is option c) Apala
Which of the following is correct about mode?- a)It is central.
- b)It occurs most frequently.
- c)It lies between the maximum and minimum observations.
- d)It is the average of the two middle terms.
Correct answer is option 'B'. Can you explain this answer?
Which of the following is correct about mode?
a)
It is central.
b)
It occurs most frequently.
c)
It lies between the maximum and minimum observations.
d)
It is the average of the two middle terms.
|
|
Aravind Iyer answered |
B) It occurs most frequently.
The mode is a measure of central tendency that represents the value or values that occur most frequently in a dataset. In other words, it is the value that appears with the highest frequency.
Explanation:
- The mode is the only measure of central tendency that focuses on the frequency of values rather than their magnitude. It is particularly useful when dealing with categorical or discrete data.
Example:
Let's consider the following dataset of exam scores: 75, 85, 90, 75, 80, 85, 75, 90, 85, 80.
To determine the mode, we need to identify the value(s) that occur most frequently. In this case, the value "75" appears three times, while all other values appear twice. Therefore, the mode of this dataset is 75.
- It is important to note that a dataset can have more than one mode if there are multiple values that occur with the same highest frequency. For example, if the dataset was: 75, 85, 90, 75, 80, 85, 75, 90, 80, 80, then both 75 and 80 would be modes since they both occur three times, while all other values occur twice.
- Unlike the mean and median, the mode can be applied to both numerical and categorical data. For example, in a dataset of favorite colors (e.g., red, blue, green, red, yellow, blue, blue), the mode would be "blue" since it occurs most frequently.
- The mode is not influenced by extreme values or outliers, making it a robust measure of central tendency. This means that even if there are values that occur significantly more or less frequently than others, they do not affect the mode.
- It is important to note that the mode is not always applicable or meaningful for every dataset. For example, in a dataset with no repeated values (e.g., 10, 20, 30, 40), there is no mode since no value occurs more frequently than others.
In conclusion, the mode is the measure of central tendency that represents the value or values that occur most frequently in a dataset, making option b) "It occurs most frequently" the correct statement about the mode.
Direction: The bar graph shows the sales of fruits and vegetables in a store in 4 hours on a certain evening.
Sales of fruits and vegetables in a store
When was the sale of fruits lesser than that of vegetables?
- a)7 p.m
- b)6 p.m
- c)8 p.m
- d)5 p.m
Correct answer is option 'B'. Can you explain this answer?
Direction: The bar graph shows the sales of fruits and vegetables in a store in 4 hours on a certain evening.
Sales of fruits and vegetables in a store
When was the sale of fruits lesser than that of vegetables?
Sales of fruits and vegetables in a store
When was the sale of fruits lesser than that of vegetables?
a)
7 p.m
b)
6 p.m
c)
8 p.m
d)
5 p.m
|
|
Dhrup Maurya answered |
Because class interval 0 - 10 has only 1 frequency who is very lowest comparison to other class intervals given in the question
So your answer is option 'A'.
So your answer is option 'A'.

The median of marks of class 95 - 100 is- a)100
- b)95.5
- c)97.5
- d)95
Correct answer is option 'C'. Can you explain this answer?
The median of marks of class 95 - 100 is
a)
100
b)
95.5
c)
97.5
d)
95

|
Sahil Desai answered |
Understanding the Median
The median is a measure of central tendency that represents the middle value in a dataset when arranged in ascending order. In this case, we are looking at the marks of a class with values ranging from 95 to 100.
Data Set Arrangement
1. Identify the marks: The marks given are 95, 96, 97, 98, 99, and 100.
2. Arrange the data: The marks are already in ascending order:
- 95, 96, 97, 98, 99, 100
Finding the Median
3. Count the numbers: There are 6 marks in total.
4. Determine the median position:
- Since there is an even number of observations (6), the median is calculated by taking the average of the two middle values.
- The two middle values are the 3rd and 4th numbers in the ordered list: 97 and 98.
5. Calculate the median:
- Median = (97 + 98) / 2 = 195 / 2 = 97.5
Conclusion
Thus, the median of the marks from 95 to 100 is 97.5, confirming that the correct option is C. This value represents the central point of the data set, giving a clear picture of the overall performance of the class.
Which class has the highest frequency?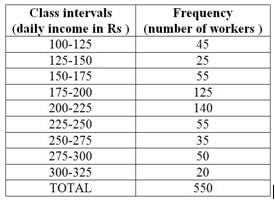
- a)250-275
- b)200-225
- c)225-250
- d)None of these
Correct answer is option 'B'. Can you explain this answer?
Which class has the highest frequency?
a)
250-275
b)
200-225
c)
225-250
d)
None of these

|
Tripti answered |
Correct answer is b because the number of workers is 140 . it is higher than others
What is the median of the data 46,64,87, 41,58,77,35,90,55,33,92?
- a)87
- b)77
- c)58
- d)60.2
Correct answer is option 'C'. Can you explain this answer?
What is the median of the data 46,64,87, 41,58,77,35,90,55,33,92?
a)
87
b)
77
c)
58
d)
60.2

|
Kaavya Menon answered |
Arranging the given data in ascending order, we have, 33, 35, 41, 46, 55, 58, 64, 77, 87, 90 and 92.
As there are 11 terms ie. odd (n+1)/2 , (11+1)/2 = 6 .The sixth entry is 58.
∴ Median is 58.
As there are 11 terms ie. odd (n+1)/2 , (11+1)/2 = 6 .The sixth entry is 58.
∴ Median is 58.
The difference between the highest and lowest observation is called- a)group
- b)range
- c)class interval
- d)class mark
Correct answer is option 'B'. Can you explain this answer?
The difference between the highest and lowest observation is called
a)
group
b)
range
c)
class interval
d)
class mark

|
Kds Coaching answered |
The difference between the highest and lowest observation of a class interval is called the range.
In the class- interval 70-80, 80 is the- a)lowest observation
- b)highest observation
- c)frequency
- d)range
Correct answer is option 'B'. Can you explain this answer?
In the class- interval 70-80, 80 is the
a)
lowest observation
b)
highest observation
c)
frequency
d)
range
|
|
Kds Coaching answered |
The highest observation is the largest quantity in the interval. So 80 is the highest observation.
The daily sales of kerosene (in litres) in a ration shop for six days is given in the box.
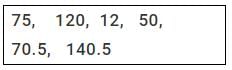
What is the average daily sale?- a)150 l
- b)10 l
- c)142 l
- d)78 l
Correct answer is option 'D'. Can you explain this answer?
The daily sales of kerosene (in litres) in a ration shop for six days is given in the box.
What is the average daily sale?
What is the average daily sale?
a)
150 l
b)
10 l
c)
142 l
d)
78 l
|
|
Shiksha Academy answered |
By definition of average, the average daily sale =
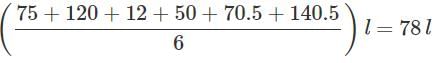
However, without calculating we can say that the answer is D since the average lies between the maximum and the minimum.
However, without calculating we can say that the answer is D since the average lies between the maximum and the minimum.
The number of tourists visiting a historical place in a week is shown in the following table: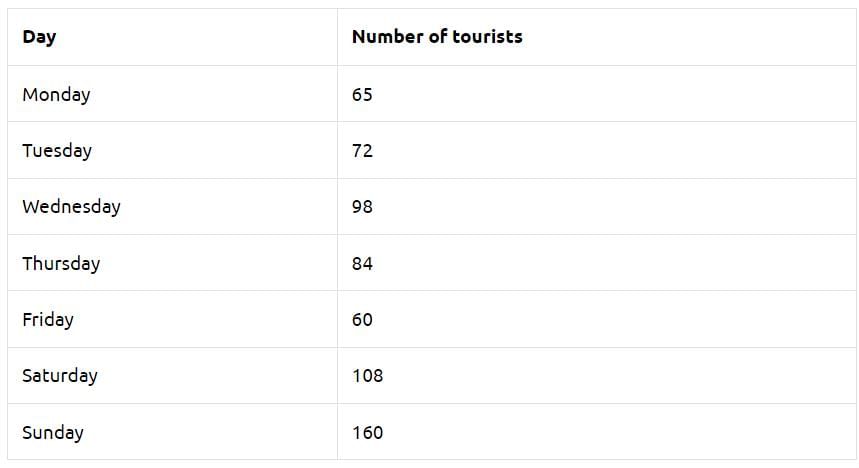 The mean of the number of tourists visiting on all days is
- a)65
- b)160
- c)98
- d)92
Correct answer is option 'D'. Can you explain this answer?
The number of tourists visiting a historical place in a week is shown in the following table:
The mean of the number of tourists visiting on all days is
a)
65
b)
160
c)
98
d)
92

|
Coachify answered |
Mean = (65 + 72 + 98 + 84 + 60 + 108 + 160) ÷ 7
= 647 ÷ 7 ≈ 92.43
= 647 ÷ 7 ≈ 92.43
So the mean is about 92 → d) 92.
Chapter doubts & questions for Data Handling - Mathematics for Grade 7 2025 is part of Grade 7 exam preparation. The chapters have been prepared according to the Grade 7 exam syllabus. The Chapter doubts & questions, notes, tests & MCQs are made for Grade 7 2025 Exam. Find important definitions, questions, notes, meanings, examples, exercises, MCQs and online tests here.
Chapter doubts & questions of Data Handling - Mathematics for Grade 7 in English & Hindi are available as part of Grade 7 exam.
Download more important topics, notes, lectures and mock test series for Grade 7 Exam by signing up for free.
Mathematics for Grade 7
132 videos|250 docs|58 tests
|
|
© EduRev
|
Education Revolution
|


|


Signup to see your scores
go up
within 7 days!
within 7 days!
Takes less than 10 seconds to signup