


All Exams >
Year 10 >
Mathematics for Year 10 >
All Questions
All questions of Graphs for Year 10 Exam
The wickets taken by a bowler in 10 cricket matches are 2, 6, 4, 5, 0, 3, 1, 3, 2, 3. The mode of the data is- a)1
- b)2
- c)3
- d)4
Correct answer is option 'C'. Can you explain this answer?
The wickets taken by a bowler in 10 cricket matches are 2, 6, 4, 5, 0, 3, 1, 3, 2, 3. The mode of the data is
a)
1
b)
2
c)
3
d)
4
|
|
Ananya Das answered |
Mode is the most frequently occurring observation. Since it's not a grouped data the frequency is the occurrence of only one observation , So the highest no. of frequency is 3 . So the modal age is 3.
| 1 Crore+ students have signed up on EduRev. Have you? Download the App |
Find out the mode of the following data:
- a)450
- b)400
- c)600
- d)478
Correct answer is option 'A'. Can you explain this answer?
Find out the mode of the following data:
a)
450
b)
400
c)
600
d)
478

|
Hearthacker answered |
The number which appears most often in a set of numbers.soA is correct one
The mean of all the factors of 24 is- a)7.5
- b)24
- c)7
- d)none of these
Correct answer is option 'A'. Can you explain this answer?
The mean of all the factors of 24 is
a)
7.5
b)
24
c)
7
d)
none of these
|
|
Official Learner answered |
Factors of 24 -- 1,2,3,4,6,8,12,24
add all the factors / total no.of terms
=60/8 = 7.5!!
add all the factors / total no.of terms
=60/8 = 7.5!!
The marks obtained by 9 students in Mathematics are 59, 46, 30, 23, 27, 44, 52, 40 and 29. The median of the data is- a)30
- b)29
- c)35
- d)40
Correct answer is option 'D'. Can you explain this answer?
The marks obtained by 9 students in Mathematics are 59, 46, 30, 23, 27, 44, 52, 40 and 29. The median of the data is
a)
30
b)
29
c)
35
d)
40
|
|
Kiran Mehta answered |
Median is the middle value of the observations. So Median cannot be obtained when the observations are not in order. So first we have to arrange in ascending order.
59, 46, 30, 23, 27, 44, 52, 40 and 29
Gives- 23,27,29,30,40,44,46,52,59
Since the no. of observations is odd

59, 46, 30, 23, 27, 44, 52, 40 and 29
Gives- 23,27,29,30,40,44,46,52,59
Since the no. of observations is odd
The mean of the first 10 natural numbers is- a)5
- b)6
- c)4.5
- d)5.5
Correct answer is option 'D'. Can you explain this answer?
The mean of the first 10 natural numbers is
a)
5
b)
6
c)
4.5
d)
5.5
|
|
Pooja Shah answered |
The first 10 natural numbers are 1, 2, 3, 4, 5, 6, 7, 8, 9 and 10.
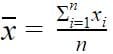
Mean = Sum of Observations/Total No of Observations
Mean = 1 + 2 + 3 + 4 + 5 + 6 + 7 + 8 + 9 + 10 ÷ 10
Mean = 55/10
Mean = 5.5
Mean = Sum of Observations/Total No of Observations
Mean = 1 + 2 + 3 + 4 + 5 + 6 + 7 + 8 + 9 + 10 ÷ 10
Mean = 55/10
Mean = 5.5
 What is the mode of the given data?
- a)24
- b)21
- c)22
- d)25
Correct answer is option 'A'. Can you explain this answer?
What is the mode of the given data?
a)
24
b)
21
c)
22
d)
25
|
|
Krishna Iyer answered |
Mode= 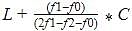
Where L=lower limit of the modal class =20
f1= modal class frequency.=27
f2 = just after the modal class frequency.=21
f0 = just previous the modal class frequency=23
C = Class size=10
Mode=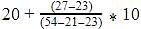
=20+4=24
Where L=lower limit of the modal class =20
f1= modal class frequency.=27
f2 = just after the modal class frequency.=21
f0 = just previous the modal class frequency=23
C = Class size=10
Mode=
=20+4=24
The measure of central tendency that can be obtained graphically is- a)mean
- b)median
- c)mode
- d)none of these
Correct answer is option 'C'. Can you explain this answer?
The measure of central tendency that can be obtained graphically is
a)
mean
b)
median
c)
mode
d)
none of these
|
|
Krishna Iyer answered |
Central tendency is the central value for a probability distribution. Mean,media,mode and range are the measures of central tendeny. Amongst them, median can be determined graphically.
The mean of 1, 2, 3, 4 …n is given by- a)

- b)n/2
- c)

- d)

Correct answer is option 'D'. Can you explain this answer?
The mean of 1, 2, 3, 4 …n is given by
a)
b)
n/2
c)
d)
|
|
Krishna Iyer answered |
⇒ We have the sequence, 1,2,3.......n
⇒ This is an AP, with the initial term a=1 and the common difference d=1.
∴ The sum of n terms of an AP is given by,
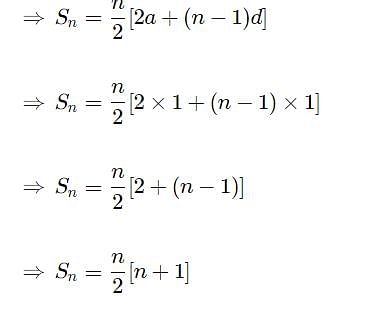
→ Arithmetic mean of n numbers a1,a2,a3,a4,...an is given by the formula
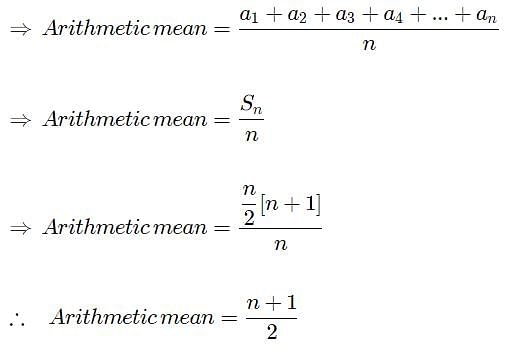
⇒ This is an AP, with the initial term a=1 and the common difference d=1.
∴ The sum of n terms of an AP is given by,
→ Arithmetic mean of n numbers a1,a2,a3,a4,...an is given by the formula
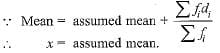
If mean = (3 median - mode). k, then the value of k is- a)1
- b)2
- c)1/2
- d)3/2
Correct answer is option 'C'. Can you explain this answer?
If mean = (3 median - mode). k, then the value of k is
a)
1
b)
2
c)
1/2
d)
3/2
|
|
Kiran Mehta answered |
∵ Mode = 3 median - 2 mean
⇒ 2 mean = 3 m edian - mode
⇒ 2 mean = 3 m edian - mode
The age of 18 students of a class is reported below. Their modal age is 10, 17, 14, 10, 11, 12, 12, 13, 17, 13, 14, 14, 15, 16, 17, 15, 17, 16- a)22 years
- b)17 years
- c)14 years
- d)16 years
Correct answer is option 'B'. Can you explain this answer?
The age of 18 students of a class is reported below. Their modal age is 10, 17, 14, 10, 11, 12, 12, 13, 17, 13, 14, 14, 15, 16, 17, 15, 17, 16
a)
22 years
b)
17 years
c)
14 years
d)
16 years
|
|
Gaurav Kumar answered |
Mode is the highest number of times an observation occurs, which means the number that appears most frequently in a set. So modal age is the age which occurs maximum number of times. It is evident that 17 occurs most of the times. So, modal age is 17 years.
The mean of the first 10 prime numbers is- a)12.9
- b)1.29
- c)129
- d)none of these
Correct answer is option 'A'. Can you explain this answer?
The mean of the first 10 prime numbers is
a)
12.9
b)
1.29
c)
129
d)
none of these
|
|
Neha Patel answered |
First 10 prime numbers = 2, 3, 5, 7, 11, 13, 17, 19, 23, 29
Mean = {2+3+5+7+11+13+17+19+23+29}/{10}
=129/10=12.9
Mean is 12.9
The arithmetic mean of a set of 40 values is 65. If each of the 40 values is increased by 5, what will be the mean of the set of new values:- a)50
- b)60
- c)70
- d)none of these
Correct answer is option 'C'. Can you explain this answer?
The arithmetic mean of a set of 40 values is 65. If each of the 40 values is increased by 5, what will be the mean of the set of new values:
a)
50
b)
60
c)
70
d)
none of these
|
|
Arun Sharma answered |
We have mean = 
Mean =
Now each value is increased by 5
Mean =
+5=65+5=70
Hence the mean is 70
Mean =
Now each value is increased by 5
Mean =
+5=65+5=70
Hence the mean is 70
The median of first 10 prime numbers is- a)11
- b)12
- c)13
- d)none of these
Correct answer is option 'B'. Can you explain this answer?
The median of first 10 prime numbers is
a)
11
b)
12
c)
13
d)
none of these
|
|
Gaurav Kumar answered |
A prime number is a natural number greater than 1 that is not a product of two smaller natural numbers. So 10 prime numbers are: 2,3,5,7,11,13,17,19,23,29
Since the number of terms are even ,
Median =
 10/2=5th term=11
 10/2 +1=6th term=13
Median =
Since the number of terms are even ,
Median =
10/2=5th term=1110/2 +1=6th term=13Median =
The mean of following distribution is –

- a)18.50
- b)18.05
- c)18.15
- d)18.25
Correct answer is option 'B'. Can you explain this answer?
The mean of following distribution is –
a)
18.50
b)
18.05
c)
18.15
d)
18.25
|
|
Ræjû Bhæï answered |
B option sahi hi n.. Bss isme khuss raho.. Aur explain chaiye toh subh ko fir milenge abhi sone ja rha hu.
The mean of the following data is: 45, 35, 20, 15, 25, 40- a)15
- b)25
- c)30
- d)35
Correct answer is option 'C'. Can you explain this answer?
The mean of the following data is: 45, 35, 20, 15, 25, 40
a)
15
b)
25
c)
30
d)
35
|
|
Pankaj verma answered |
Mean of Data Set
To find the mean of a data set, we add up all the numbers in the set and then divide by the total number of values in the set.
Calculation
To find the mean of the given data set, we need to add up all the numbers in the set and then divide by the total number of values in the set:
Mean = (45 + 35 + 20 + 15 + 25 + 40) / 6
Mean = 180 / 6
Mean = 30
Therefore, the mean of the given data set is 30. The correct answer is option C.
The mean of the following data 12, 22, 32,.......n2 is –- a)(n+1)(2n+1)/6
- b)n(n – 1)(2n+1)/6
- c)n(n+1)(2n – 1)/6
- d)n(n – 1)(2n – 1)/6
Correct answer is option 'A'. Can you explain this answer?
The mean of the following data 12, 22, 32,.......n2 is –
a)
(n+1)(2n+1)/6
b)
n(n – 1)(2n+1)/6
c)
n(n+1)(2n – 1)/6
d)
n(n – 1)(2n – 1)/6
|
|
Lighτ Yαmɪ answered |
Sum of Series 1²+2²+3²+….+n² = n(n+1)(2n+1)/6
[as, (1+2+3+4+…..n) = n(n+1) / 2
Using the identity: a^3 -b^3 = (a-b)(a² +ab +b²)
We get, x^3 -(x-1)^3 = 3x² -3x +1 , by putting x = 1,2,3…n
We get,
1^3 - 0^3 = 3×1² - 3×1 + 1
2^3 -1^3 = 3×2² - 3×2 +1
3^3 - 2^3 = 3×3² - 3×3 +1
…..
n^3 - (n-1)^3 = 3*n² - 3n +1
By adding LHS up to x=3
1^3–0^3 + 2^3–1^3 + 3^3–2^3 = 3^3 -0^3
So by adding LHS up to x= n
We get, n^3 - 0^3 …….. LHS
Now by adding RHS =
3( 1²+2²+3² +…n²) - 3( 1+2+3+….n) + n
=3(1²+2²+3²+..n²) = n^3 +3(1+2+3+…n) -n
=(1² +2²+3²+..n²) = 1/3 [n^3 +(3 n(n+1)/2) - n]
=(1²+2² +3² +..n²) = 1/3 [ (2n^3 +3n²+3n - 2n) /2 ]
= (1²+2²+3²+..n²) = ( 2n^3 +3n² +n) /6
=n (n+1)(2n+1) /6]
mean=sum/number of terms
=n(n+1)(2n+1)/6×n
=(n+1) (2n+1) /6
Hence, option A is correct
Practice Test/Quiz or MCQ (Multiple Choice Questions) with Solutions of Chapter "Statistics" are available for CBSE Class 10 Mathematics (Maths) and have been compiled as per the syllabus of CBSE Class 10 Mathematics (Maths) Q. Which of the following is a measure of central tendency?- a)Frequency
- b)Cumulative frequency
- c)Mean
- d)Class limit
Correct answer is option 'C'. Can you explain this answer?
Practice Test/Quiz or MCQ (Multiple Choice Questions) with Solutions of Chapter "Statistics" are available for CBSE Class 10 Mathematics (Maths) and have been compiled as per the syllabus of CBSE Class 10 Mathematics (Maths)
Q. Which of the following is a measure of central tendency?
a)
Frequency
b)
Cumulative frequency
c)
Mean
d)
Class limit
|
|
Rahul Kapoor answered |
There are three main measures of central tendency: the mode, the median and the mean. Each of these measures describes a different indication of the typical or central value in the distribution. The mode is the most commonly occurring value in a distribution.
The mean of five numbers is 28. If one of the numbers is excluded, the mean gets reduced by 2. The excluded number is- a)45
- b)36
- c)30
- d)25
Correct answer is option 'B'. Can you explain this answer?
The mean of five numbers is 28. If one of the numbers is excluded, the mean gets reduced by 2. The excluded number is
a)
45
b)
36
c)
30
d)
25
|
|
Vikas Kumar answered |
Mean of 5 nos.= 28
Therefore, sum of the 5 nos. = 28 * 5 = 140
The the no. exclude by 'x'.
New sum of 4 nos.= 140 - x
New mean = 28- 2 = 26
Therefore, (140 - x ) / 4 = 26
=> 140 - x = 104
=> x = 36
ANSWER= 36
The mean of 15 numbers is 25. If each number is multiplied by 4, mean of the new numbers is- a)100
- b)40
- c)10
- d)60
Correct answer is option 'A'. Can you explain this answer?
The mean of 15 numbers is 25. If each number is multiplied by 4, mean of the new numbers is
a)
100
b)
40
c)
10
d)
60
|
|
Anmol Das answered |
Answer:
100
Step-by-step explanation:
mean=25
every number is multiplied by 4,
then 4 is common
Therefore, 25x4=100
In a data, if l = 60, h = 15, f1 = 16, f0 = 6, f2 = 6, then the mode is- a)60
- b)72
- c)67.5
- d)none of these
Correct answer is option 'C'. Can you explain this answer?
In a data, if l = 60, h = 15, f1 = 16, f0 = 6, f2 = 6, then the mode is
a)
60
b)
72
c)
67.5
d)
none of these
|
|
Shreya Shajilal answered |
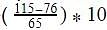
Mode=l+(f1-f0/2f1-f0-f2)×h
=60+(16-6/2×16-6-6)×15
=60+(10/20)×15
=60+(1/2)×15
=60+15/2
=60+7.5
=67.5.
Therefore the mode is 67.5.
=60+(16-6/2×16-6-6)×15
=60+(10/20)×15
=60+(1/2)×15
=60+15/2
=60+7.5
=67.5.
Therefore the mode is 67.5.
The marks obtained by 9 students in Mathematics are 59, 46, 31, 23, 27, 44, 52, 40 and 29. The mean of the data is- a)37
- b)38
- c)39
- d)40
Correct answer is option 'C'. Can you explain this answer?
The marks obtained by 9 students in Mathematics are 59, 46, 31, 23, 27, 44, 52, 40 and 29. The mean of the data is
a)
37
b)
38
c)
39
d)
40
|
|
Avinash Patel answered |
The mean is the average of the numbers.
So, Mean =
Mean=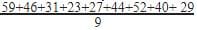 351/9=39
So, Mean =
Mean=
351/9=39The marks obtained by 9 students in Mathematics are 59, 46, 31, 23, 27, 40, 52, 35 and 29. The mean of the data is- a)23
- b)30
- c)38
- d)41
Correct answer is option 'C'. Can you explain this answer?
The marks obtained by 9 students in Mathematics are 59, 46, 31, 23, 27, 40, 52, 35 and 29. The mean of the data is
a)
23
b)
30
c)
38
d)
41
|
|
Pooja Shah answered |
The mean is the average of the numbers.
So, Mean =
Mean=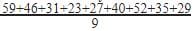 =342/9=38
So, Mean =
Mean=
=342/9=38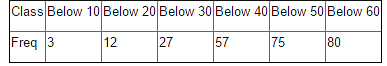
The mean of the first 10 multiples of 6 is- a)3.3
- b)33
- c)34
- d)none of these
Correct answer is option 'B'. Can you explain this answer?
The mean of the first 10 multiples of 6 is
a)
3.3
b)
33
c)
34
d)
none of these
|
|
Ananya Das answered |
We have first ten multiples of 6 as follows:
6,12,18,24,30,36,42,48,54,60

6,12,18,24,30,36,42,48,54,60
The mean of first ten even natural numbers is- a)100
- b)11
- c)30
- d)10
Correct answer is option 'B'. Can you explain this answer?
The mean of first ten even natural numbers is
a)
100
b)
11
c)
30
d)
10
|
|
Anmol Das answered |
Mean of First Ten Even Natural Numbers
To find the mean of the first ten even natural numbers, we need to add all the even numbers and divide the sum by the total number of even numbers. The first ten even natural numbers are:
2, 4, 6, 8, 10, 12, 14, 16, 18, 20
1. Add up the Even Numbers
Add up all the even numbers:
2 + 4 + 6 + 8 + 10 + 12 + 14 + 16 + 18 + 20 = 110
2. Divide the Sum by the Total Number of Even Numbers
Since there are 10 even numbers in the list, we divide the sum by 10:
110 ÷ 10 = 11
Therefore, the mean of the first ten even natural numbers is 11. Option 'B' is the correct answer.
The mean of a data set with 12 observations is calculated as 19.25. If one more value is included in the data, then for the new data with 13 observations, mean becomes 20. Value of this 13th observation is- a)28
- b)29
- c)31
- d)30
Correct answer is option 'B'. Can you explain this answer?
The mean of a data set with 12 observations is calculated as 19.25. If one more value is included in the data, then for the new data with 13 observations, mean becomes 20. Value of this 13th observation is
a)
28
b)
29
c)
31
d)
30
|
|
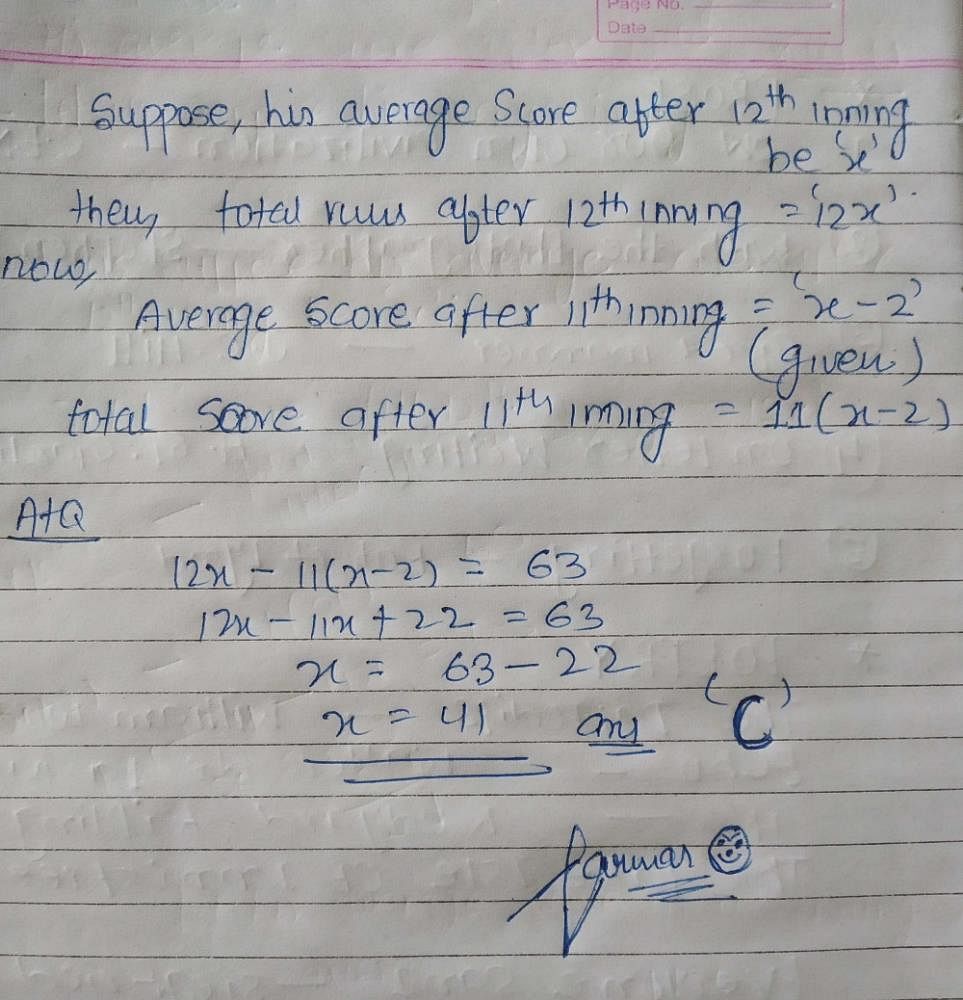
Anita Menon answered |
Suppose be all twelevth terms = x
Mean = Terms / Observation
19 . 25 = x / 12
x = 19.25 × 12
x = 231 .00
Now let thirteenth term will be y
Mean = 20
So, 20 = x + y / 13
20 = 231 + y / 13
20 × 13 = 231 + x
260 = 231 + x
260 - 231 = x
29 = x
Mean = Terms / Observation
19 . 25 = x / 12
x = 19.25 × 12
x = 231 .00
Now let thirteenth term will be y
Mean = 20
So, 20 = x + y / 13
20 = 231 + y / 13
20 × 13 = 231 + x
260 = 231 + x
260 - 231 = x
29 = x
Consider the following frequency distribution of the height of 60 students of a class:
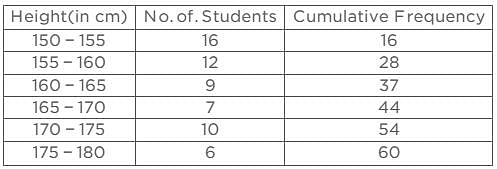
The sum of the lower limit of the modal class and upper limit of the median class is
- a)310
- b)315
- c)320
- d)330
Correct answer is option 'B'. Can you explain this answer?
Consider the following frequency distribution of the height of 60 students of a class:
The sum of the lower limit of the modal class and upper limit of the median class is
The sum of the lower limit of the modal class and upper limit of the median class is
a)
310
b)
315
c)
320
d)
330

|
Reena Chourasia answered |
Modal class 150---155
lower limit of modal class -- 150
n=60
n/2=30
median class=160----165
upper limit of median class is 165
sum of lower limit of modal class and upper limit of median class=150+165=315
lower limit of modal class -- 150
n=60
n/2=30
median class=160----165
upper limit of median class is 165
sum of lower limit of modal class and upper limit of median class=150+165=315
Mode is not affected by- a)Maximum value
- b)Minimum value
- c)Extreme values
- d)All of the above
Correct answer is option 'D'. Can you explain this answer?
Mode is not affected by
a)
Maximum value
b)
Minimum value
c)
Extreme values
d)
All of the above
|
|
Krishna Iyer answered |
The mode of a set of data values is the value that appears most often.it is the value that is most likely to be sampled This means mode is the observations whose frequency is highest. So it does not pay attention to what is the maximum value or the minimum value . So it is not affected either by maximum or minimum values and its not affected by both as well.
While computing mean of a grouped data, we assume that the frequencies are- a)centered at the lower limits of the classes
- b)centered at the upper limits of the classes
- c)centered at the class marks of the classes
- d)evenly distributed over all the classes
Correct answer is option 'C'. Can you explain this answer?
While computing mean of a grouped data, we assume that the frequencies are
a)
centered at the lower limits of the classes
b)
centered at the upper limits of the classes
c)
centered at the class marks of the classes
d)
evenly distributed over all the classes
|
|
Swati Malkani answered |
Option C is correct
The mean of the first 10 natural odd numbers is- a)9
- b)10
- c)11
- d)12
Correct answer is option 'B'. Can you explain this answer?
The mean of the first 10 natural odd numbers is
a)
9
b)
10
c)
11
d)
12
|
|
Ananya Das answered |
Natural numbers start from 1
First ten natural odd numbers=1,3,5,7,9,11,13,15,17,19
Mean =
So mean is 10.
First ten natural odd numbers=1,3,5,7,9,11,13,15,17,19
Mean =
So mean is 10.
The value of 
- a)

- b)

- c)

- d)

Correct answer is option 'C'. Can you explain this answer?
The value of
a)
b)
c)
d)
|
|
Arun Sharma answered |
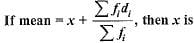
We have Mean = 
The class mark of the class 15.5 - 20.5
- a)15.5
- b)20.5
- c)18
- d)5
Correct answer is option 'C'. Can you explain this answer?
The class mark of the class 15.5 - 20.5
a)
15.5
b)
20.5
c)
18
d)
5
|
|
Avik Chatterjee answered |
**Explanation:**
To find the class mark of a class interval, we need to find the average of the lower class limit and the upper class limit.
In this case, the class interval is 15.5 - 20.5.
- The lower class limit is 15.5.
- The upper class limit is 20.5.
**Calculating the class mark:**
To find the class mark, we add the lower class limit and the upper class limit and divide the sum by 2.
Class mark = (Lower class limit + Upper class limit) / 2
Class mark = (15.5 + 20.5) / 2
Class mark = 36 / 2
Class mark = 18
Therefore, the class mark of the class interval 15.5 - 20.5 is 18.
**Explanation of options:**
a) 15.5: This is the lower class limit, not the class mark.
b) 20.5: This is the upper class limit, not the class mark.
c) 18: This is the correct answer. It is calculated by finding the average of the lower class limit and the upper class limit.
d) 5: This is not relevant to the given class interval.
Therefore, the correct answer is option 'C' which represents the class mark of the class interval 15.5 - 20.5.
The lower limit of the modal class of the following data is: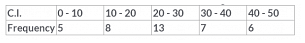
- a)10
- b)20
- c)30
- d)50
Correct answer is option 'B'. Can you explain this answer?
The lower limit of the modal class of the following data is:
a)
10
b)
20
c)
30
d)
50
|
|
Raghav Bansal answered |
Modal class is the interval which has the highest frequency ie, which occur most of the times.Here highest frequency is 13 in the class interval 20-30. So lower limit of the class interval is 20.

The class marks of the class 18-22 is- a)4
- b)18
- c)22
- d)20
Correct answer is option 'D'. Can you explain this answer?
The class marks of the class 18-22 is
a)
4
b)
18
c)
22
d)
20
|
|
Harshit Agrawal answered |
We know that ,
Class Mark = upper limit + lower limit /2
--->. Class Mark = 22 + 18/2
--->. Class Mark = 40/2
--->. Class Mark = 20
Hence , option D is correct.
Class Mark = upper limit + lower limit /2
--->. Class Mark = 22 + 18/2
--->. Class Mark = 40/2
--->. Class Mark = 20
Hence , option D is correct.
Which of the following is true –- a)Mode = 3Median + 2Mean
- b)Median = Mode +3/2[Mean – Median]
- c)Mean = Mode + 3/2[Median – Mode]
- d)Median = Mode + 3/2[Median + Mode]
Correct answer is option 'C'. Can you explain this answer?
Which of the following is true –
a)
Mode = 3Median + 2Mean
b)
Median = Mode +3/2[Mean – Median]
c)
Mean = Mode + 3/2[Median – Mode]
d)
Median = Mode + 3/2[Median + Mode]
|
|
Amit Sharma answered |
Mean = Mode + 3/2 [Median – Mode]
Mean= Mode+3/2 Median-3/2Mode
2 Mean=2 Mode+3 Median-3 Mode
3 Median=2 Mean + Mode
So C is the correct answer.
Mean= Mode+3/2 Median-3/2Mode
2 Mean=2 Mode+3 Median-3 Mode
3 Median=2 Mean + Mode
So C is the correct answer.
The mode of 4, 5, 6, 8, 5, 4, 8, 5, 6, x, 8 is 8. The value of ‘x’ is- a)4
- b)5
- c)6
- d)8
Correct answer is option 'D'. Can you explain this answer?
The mode of 4, 5, 6, 8, 5, 4, 8, 5, 6, x, 8 is 8. The value of ‘x’ is
a)
4
b)
5
c)
6
d)
8
|
|
Amit Sharma answered |
Mode is the most occurred value. In the data we have three 5 and three 8 , so if mode is only 8 then the value of x must be 8 ,so that only 8 is the most occurring value.
In a data, if l = 40, h = 15, f1=7, f0=3, f2=6, then the mode is- a)52
- b)62
- c)72
- d)none of these
Correct answer is option 'A'. Can you explain this answer?
In a data, if l = 40, h = 15, f1=7, f0=3, f2=6, then the mode is
a)
52
b)
62
c)
72
d)
none of these
|
|
Vivek Rana answered |
Mode=L+ 
Where L=lower limit of the modal class =40
f1= modal class frequency.=7
f2 = just after the modal class frequency.=6
f0 = just previous the modal class frequency=3
C = Class size=15
Mode=40+ * 15 = 40 + 12 = 52
Where L=lower limit of the modal class =40
f1= modal class frequency.=7
f2 = just after the modal class frequency.=6
f0 = just previous the modal class frequency=3
C = Class size=15
Mode=40+
* 15 = 40 + 12 = 52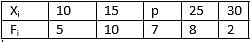

Mean of 100 items is 49. It was discovered that three items which should have been 60, 70, 80 were wrongly read as 40, 20, 50 respectively. The correct mean is- a)48
- b)49
- c)50
- d)60
Correct answer is option 'C'. Can you explain this answer?
Mean of 100 items is 49. It was discovered that three items which should have been 60, 70, 80 were wrongly read as 40, 20, 50 respectively. The correct mean is
a)
48
b)
49
c)
50
d)
60
|
|
Ananya Das answered |
Sum of 100 observations = 100 x 49 = 4900
Correct sum = 4900 - [40 + 20 + 50] + [60 + 70 + 80] = 5000
∴ Correct mean = 5000/100 = 50
Correct sum = 4900 - [40 + 20 + 50] + [60 + 70 + 80] = 5000
∴ Correct mean = 5000/100 = 50


Mode and mean of a data are 12k and 15k. Median of the data is- a)12k
- b)14k
- c)15k
- d)16k
Correct answer is option 'B'. Can you explain this answer?
Mode and mean of a data are 12k and 15k. Median of the data is
a)
12k
b)
14k
c)
15k
d)
16k
|
|
Amit Kumar answered |
Here's the solution to your question:
If two values are given in the below formula than we can use the formula if one is given than we cannot use the formula
3median = 2mean+mode
3median = 2(15k)+12k
3median = 30k+12k
3median = 42k
median = 42k/3
median = 14k
You can understand all the concepts of Class 10 mathematics through the link:

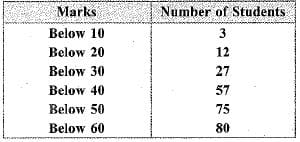
The modal class in the following frequency distribution is: 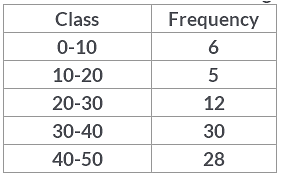
- a)40-50
- b)30-40
- c)20-30
- d)None of these
Correct answer is option 'B'. Can you explain this answer?
The modal class in the following frequency distribution is:
a)
40-50
b)
30-40
c)
20-30
d)
None of these
|
|
Raghav Bansal answered |
The modal class is the class with the highest frequency ie, the class which occurs the most. So,30-40 has frequency 30 which is the highest, therefore, 30-40 is the modal class.
The mean of 5 observations x, x + 2, x + 4, x + 6 and x + 8 is 11, then the value of x is:- a)6
- b)4
- c)7
- d)11
Correct answer is option 'C'. Can you explain this answer?
The mean of 5 observations x, x + 2, x + 4, x + 6 and x + 8 is 11, then the value of x is:
a)
6
b)
4
c)
7
d)
11
|
|
Krishna Iyer answered |
(x + x + 2 + x + 4 + x + 6 + x + 8) / 5 = 11
5x + 20 = 55
5x = 35 ⇒ x = 7
5x + 20 = 55
5x = 35 ⇒ x = 7
The mean of first 10 composite numbers is- a)11.2
- b)12.2
- c)11.4
- d)none of these
Correct answer is option 'A'. Can you explain this answer?
The mean of first 10 composite numbers is
a)
11.2
b)
12.2
c)
11.4
d)
none of these
|
|
Harshit Agrawal answered |
First 10 composite numbers are :
4, 6, 8, 9, 10, 12, 14, 15, 16, 18.
Mean = Sum of all observations ÷ Total no: of observations.
Sum of all observations = 4 + 6 + 8 + 9 + 1 0 +12 + 1 4 +15+ 16 + 18 = 112
Total no : of observations : 10
Mean = 112 / 10
= 11.2
4, 6, 8, 9, 10, 12, 14, 15, 16, 18.
Mean = Sum of all observations ÷ Total no: of observations.
Sum of all observations = 4 + 6 + 8 + 9 + 1 0 +12 + 1 4 +15+ 16 + 18 = 112
Total no : of observations : 10
Mean = 112 / 10
= 11.2
The mode of 4, 5, 6, 8, 5, 4, 6, 5, 6, x, 8 is 6. The value of ‘x’ is- a)6
- b)5
- c)4
- d)8
Correct answer is option 'A'. Can you explain this answer?
The mode of 4, 5, 6, 8, 5, 4, 6, 5, 6, x, 8 is 6. The value of ‘x’ is
a)
6
b)
5
c)
4
d)
8
|
|
SINGH answered |
Count the nos. and do half of this then arrange all the nos. in ascending order, u will found that mode is lying betn 6,_,6, so value of x is 6 ////
Chapter doubts & questions for Graphs - Mathematics for Year 10 2024 is part of Year 10 exam preparation. The chapters have been prepared according to the Year 10 exam syllabus. The Chapter doubts & questions, notes, tests & MCQs are made for Year 10 2024 Exam. Find important definitions, questions, notes, meanings, examples, exercises, MCQs and online tests here.
Chapter doubts & questions of Graphs - Mathematics for Year 10 in English & Hindi are available as part of Year 10 exam.
Download more important topics, notes, lectures and mock test series for Year 10 Exam by signing up for free.
Mathematics for Year 10
101 videos|327 docs|113 tests
|
Signup to see your scores go up within 7 days!
Study with 1000+ FREE Docs, Videos & Tests
10M+ students study on EduRev
|
© EduRev
|
Education Revolution
|


Follow Us
|


Signup to see your scores
go up within 7 days!
Access 1000+ FREE Docs, Videos and Tests
Takes less than 10 seconds to signup