Quant Mock Test - 14 - CLAT MCQ
15 Questions MCQ Test - Quant Mock Test - 14
Directions: Study the following graph and answer the questions given below:
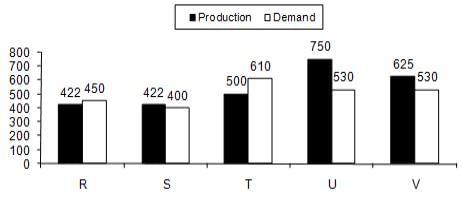
Q. The demand of refrigerator of company ‘S’ was approximately what percent of company ‘R’?

Directions: Study the following graph and answer the questions given below:
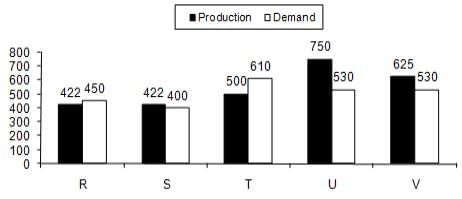
Q. The difference between the average production and the average demand of the five companies taken together is?

Directions: Study the following graph and answer the questions given below:
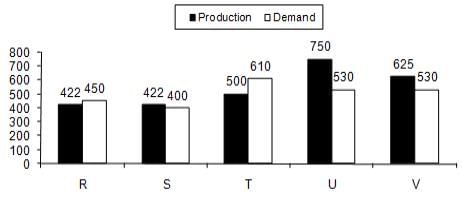
Q. Which two companies have equal demand for refrigerators?

Directions: Study the following graph and answer the questions given below:
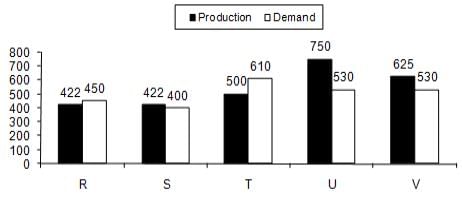
Q. Which of the following companies has the largest difference between demand and supply?
Directions: Study the following graph and answer the questions given below:
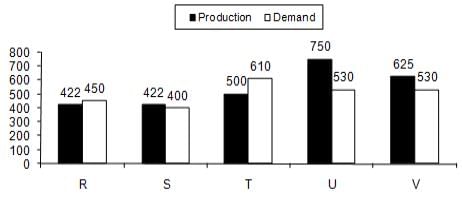
Q. Which companies have their productions greater than the average of all the five companies taken together?
Directions: In the following line graph the goods produced by a company (in tonnes) from 2001 to 2008 is shown. On this basis answer the following questions.
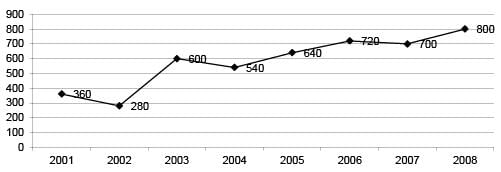
Q. The average amount of production from 2001 to 2005 is
Directions: In the following line graph the goods produced by a company (in tonnes) from 2001 to 2008 is shown. On this basis answer the following questions.

Q. The ratio of maximum to minimum quantity produced during 2001-08 is
Directions: In the following line graph the goods produced by a company (in tonnes) from 2001 to 2008 is shown. On this basis answer the following questions.

Q. The maximum percentage rise in production from its previous years is
Directions: In the following line graph the goods produced by a company (in tonnes) from 2001 to 2008 is shown. On this basis answer the following questions.

Q. The percentage rise in production from 2003 to 2008 is
Directions: In the following line graph the goods produced by a company (in tonnes) from 2001 to 2008 is shown. On this basis answer the following questions.

Q. What is the total production from 2001 to 2008?
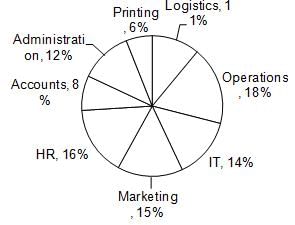
Directions: Study the following information carefully to answer these questions.
Percentage of employees in various departments of an organization and the male female ratio Total no. of Employees = 2500
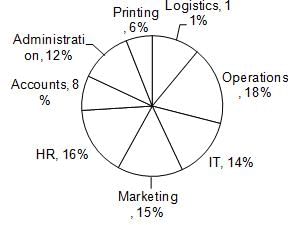
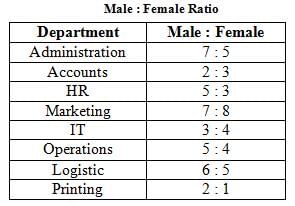
Q. What is the ratio of male employees in Administration to those in Printing Department?
Directions: Study the following information carefully to answer these questions.
Percentage of employees in various departments of an organization and the male female ratio Total no. of Employees = 2500
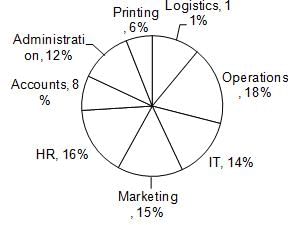
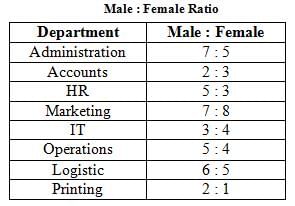
Q. What is the difference between the total number of employees in IT and that in Operations Department?
Directions: Study the following information carefully to answer these questions.
Percentage of employees in various departments of an organization and the male female ratio Total no. of Employees = 2500
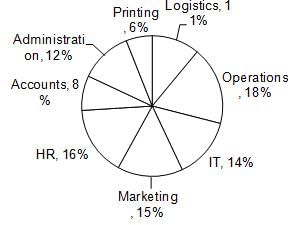
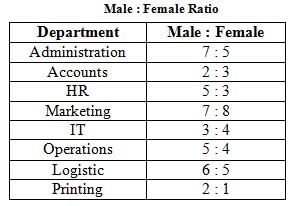
Q. What is the ratio of the total number of males in HR and Marketing to the total number of females in these two departments?
Directions: Study the following information carefully to answer these questions.
Percentage of employees in various departments of an organization and the male female ratio Total no. of Employees = 2500
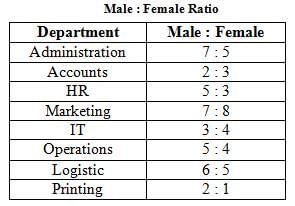
Q. How many female employees are there in the HR Department?
Directions: Study the following information carefully to answer these questions.
Percentage of employees in various departments of an organization and the male female ratio Total no. of Employees = 2500
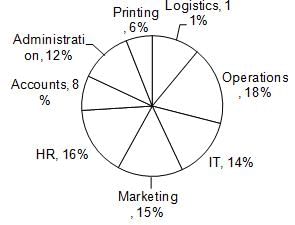
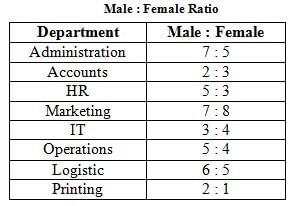
Q. What is the difference between the numbers of male and female employees in Logistics Department?


