Quant Mock Test - 16 - CLAT MCQ
15 Questions MCQ Test - Quant Mock Test - 16
Directions: Study the following pie chart carefully and answer the questions given below:
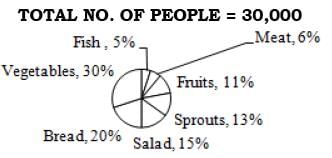
Q. What is the total number of people preferring vegetables and those preferring sprouts?

Directions: Study the following pie chart carefully and answer the questions given below:
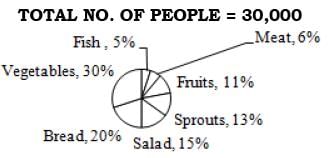
Q. What is the difference between the total number of people preferring meat to the total number of people preferring fish?

Directions: Study the following pie chart carefully and answer the questions given below:
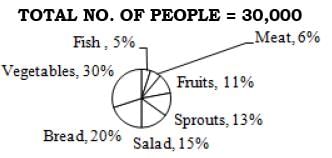
Q. People preferring fruits are approximately what percent of the people preferring vegetables?

Directions: Study the following pie chart carefully and answer the questions given below:

Q. Out of the total sample population, how many people have given preference for fish?
Directions: Study the following pie chart carefully and answer the questions given below:

Q. What is the ratio of the number of people preferring meat to the number of people preferring salad?
Directions: Study the following table carefully to answer the questions that follow:
Over the years

Q. What is the percent increase in the number of students in college T in the year 2007 from the previous year? (Rounded off to two digit after decimal)
Directions: Study the following table carefully to answer the questions that follow:
Over the years

Q. What is the total number of students from all the colleges together in the year 2005?
Directions: Study the following table carefully to answer the questions that follow:
Over the years

Q. What is the average number of students in all the colleges together in the year 2004? (Rounded off to the nearest integer)
Directions: Study the following table carefully to answer the questions that follow:
Over the years

Q. The number of students in college P in the year 2008 forms approximately what percent of the total number of students in that college from all the years together?
Directions: Study the following table carefully to answer the questions that follow:
Over the years

Q. What is the ratio of the number of students in college S in the year 2006 and 2009 together to the total number of students in that college U from the same years?
Directions: Study the following pie-chart carefully to answer the questions that follow.
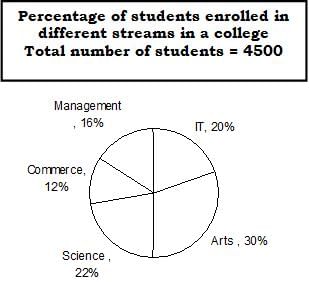
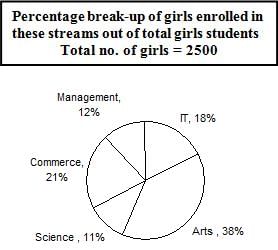
Q. What is the total number of boys enrolled in management and IT together?
Directions: Study the following pie-chart carefully to answer the questions that follow.


Q. What is the ratio of the number of girls enrolled in Arts to the number of boys enrolled in Science?
Directions: Study the following pie-chart carefully to answer the questions that follow.


Q. What is the total number of girls enrolled in Science and Commerce together?
Directions: Study the following pie-chart carefully to answer the questions that follow.


Q. If 20% of the girls enrolled in Science change their stream to Management. Then how many students will be there in management altogether?
Directions: Study the following pie-chart carefully to answer the questions that follow.


Q. The number of girls enrolled in Arts, Science and Commerce forms approximately what per cent of total number of students in the college?


