Class 11 Exam > Class 11 Questions > Stress vs strain graph?
Start Learning for Free
Stress vs strain graph?
Most Upvoted Answer
Stress vs strain graph?
Stress vs Strain Graph: Explained
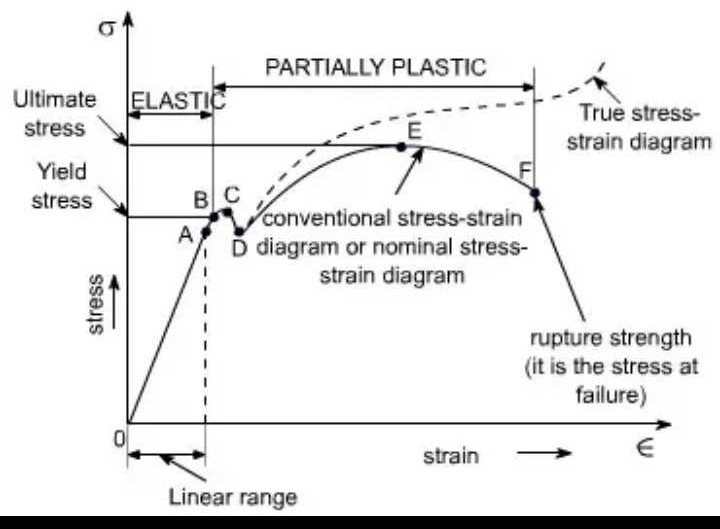
A stress vs strain graph is a visual representation of how a material responds to external forces. It plots the relationship between the amount of stress applied to a material and the resulting strain or deformation that occurs. Understanding this relationship is important for designing and testing materials for various applications.
Stress
- Stress is the amount of force per unit area that is applied to a material.
- It can be calculated by dividing the force applied by the cross-sectional area of the material.
- Stress is typically measured in units of pounds per square inch (psi) in the English system or pascals (Pa) in the metric system.
Strain
- Strain is the amount of deformation that occurs in a material due to the applied stress.
- It is typically measured as a percentage of the original length or size of the material.
- Strain can be calculated by dividing the change in length or size by the original length or size of the material.
Types of Stress vs Strain Graphs
- Elastic Region: This is the region of the graph where the material will return to its original shape once the stress is removed. The slope of the graph in this region is known as Young’s Modulus.
- Plastic Region: This is the region of the graph where the material will not return to its original shape once the stress is removed. The slope of the graph in this region is known as the Yield Strength.
- Ultimate Strength: This is the point on the graph where the material reaches its maximum stress before breaking.
- Fracture Point: This is the point on the graph where the material breaks.
Applications
The stress vs strain graph is an important tool for engineers and scientists in designing and testing materials for various applications. It helps them understand the behavior of materials under different conditions and allows them to choose the best material for a particular application. For example, a material that is used in a bridge or building must be able to withstand the stresses and strains it will experience over its lifetime without breaking or deforming too much.
Community Answer
Stress vs strain graph?


|
Explore Courses for Class 11 exam
|

|
Similar Class 11 Doubts
Stress vs strain graph?
Question Description
Stress vs strain graph? for Class 11 2025 is part of Class 11 preparation. The Question and answers have been prepared according to the Class 11 exam syllabus. Information about Stress vs strain graph? covers all topics & solutions for Class 11 2025 Exam. Find important definitions, questions, meanings, examples, exercises and tests below for Stress vs strain graph?.
Stress vs strain graph? for Class 11 2025 is part of Class 11 preparation. The Question and answers have been prepared according to the Class 11 exam syllabus. Information about Stress vs strain graph? covers all topics & solutions for Class 11 2025 Exam. Find important definitions, questions, meanings, examples, exercises and tests below for Stress vs strain graph?.
Solutions for Stress vs strain graph? in English & in Hindi are available as part of our courses for Class 11.
Download more important topics, notes, lectures and mock test series for Class 11 Exam by signing up for free.
Here you can find the meaning of Stress vs strain graph? defined & explained in the simplest way possible. Besides giving the explanation of
Stress vs strain graph?, a detailed solution for Stress vs strain graph? has been provided alongside types of Stress vs strain graph? theory, EduRev gives you an
ample number of questions to practice Stress vs strain graph? tests, examples and also practice Class 11 tests.

|
Explore Courses for Class 11 exam
|

|
Signup for Free!
Signup to see your scores go up within 7 days! Learn & Practice with 1000+ FREE Notes, Videos & Tests.


