


GMAT Exam > GMAT Questions > The following figure shows the day by day ear...
Start Learning for Free
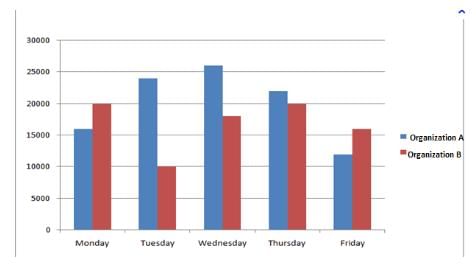
The following figure shows the day by day earnings of two different organizations (i.e., A and B) in a week. The vertical line is showing the amount earned in dollars and the horizontal line is showing the days of the week. Analyzing the graph shown below answer the questions given.
Q. Considering the trends in days Monday, Tuesday and Friday,_______ was the lower earner?
Q. Considering the trends in days Monday, Tuesday and Friday,_______ was the lower earner?
- a)Organization A
- b)Organization B
Correct answer is option 'B'. Can you explain this answer?

Verified Answer
The following figure shows the day by day earnings of two different or...
Organization B
On Monday, organization A earned about $16000 and organization B earned about $20,000. On Tuesday, Organization A earned about $26,000 and organization B earned about $10,000. On Friday, Organization A earned about $12,000 and organization B earned about $16,000. So the total amount of money earned by Organization A (i.e., $54000) is higher than that of organization B (i.e., $46000).

|
Explore Courses for GMAT exam
|
|
Top Courses for GMATView all


Question Description
The following figure shows the day by day earnings of two different organizations (i.e., A and B) in a week. The vertical line is showing the amount earned in dollars and the horizontal line is showing the days of the week. Analyzing the graph shown below answer the questions given.Q.Considering the trends in days Monday, Tuesday and Friday,_______ was the lower earner?a)Organization Ab)Organization BCorrect answer is option 'B'. Can you explain this answer? for GMAT 2025 is part of GMAT preparation. The Question and answers have been prepared according to the GMAT exam syllabus. Information about The following figure shows the day by day earnings of two different organizations (i.e., A and B) in a week. The vertical line is showing the amount earned in dollars and the horizontal line is showing the days of the week. Analyzing the graph shown below answer the questions given.Q.Considering the trends in days Monday, Tuesday and Friday,_______ was the lower earner?a)Organization Ab)Organization BCorrect answer is option 'B'. Can you explain this answer? covers all topics & solutions for GMAT 2025 Exam. Find important definitions, questions, meanings, examples, exercises and tests below for The following figure shows the day by day earnings of two different organizations (i.e., A and B) in a week. The vertical line is showing the amount earned in dollars and the horizontal line is showing the days of the week. Analyzing the graph shown below answer the questions given.Q.Considering the trends in days Monday, Tuesday and Friday,_______ was the lower earner?a)Organization Ab)Organization BCorrect answer is option 'B'. Can you explain this answer?.
The following figure shows the day by day earnings of two different organizations (i.e., A and B) in a week. The vertical line is showing the amount earned in dollars and the horizontal line is showing the days of the week. Analyzing the graph shown below answer the questions given.Q.Considering the trends in days Monday, Tuesday and Friday,_______ was the lower earner?a)Organization Ab)Organization BCorrect answer is option 'B'. Can you explain this answer? for GMAT 2025 is part of GMAT preparation. The Question and answers have been prepared according to the GMAT exam syllabus. Information about The following figure shows the day by day earnings of two different organizations (i.e., A and B) in a week. The vertical line is showing the amount earned in dollars and the horizontal line is showing the days of the week. Analyzing the graph shown below answer the questions given.Q.Considering the trends in days Monday, Tuesday and Friday,_______ was the lower earner?a)Organization Ab)Organization BCorrect answer is option 'B'. Can you explain this answer? covers all topics & solutions for GMAT 2025 Exam. Find important definitions, questions, meanings, examples, exercises and tests below for The following figure shows the day by day earnings of two different organizations (i.e., A and B) in a week. The vertical line is showing the amount earned in dollars and the horizontal line is showing the days of the week. Analyzing the graph shown below answer the questions given.Q.Considering the trends in days Monday, Tuesday and Friday,_______ was the lower earner?a)Organization Ab)Organization BCorrect answer is option 'B'. Can you explain this answer?.
Solutions for The following figure shows the day by day earnings of two different organizations (i.e., A and B) in a week. The vertical line is showing the amount earned in dollars and the horizontal line is showing the days of the week. Analyzing the graph shown below answer the questions given.Q.Considering the trends in days Monday, Tuesday and Friday,_______ was the lower earner?a)Organization Ab)Organization BCorrect answer is option 'B'. Can you explain this answer? in English & in Hindi are available as part of our courses for GMAT.
Download more important topics, notes, lectures and mock test series for GMAT Exam by signing up for free.
Here you can find the meaning of The following figure shows the day by day earnings of two different organizations (i.e., A and B) in a week. The vertical line is showing the amount earned in dollars and the horizontal line is showing the days of the week. Analyzing the graph shown below answer the questions given.Q.Considering the trends in days Monday, Tuesday and Friday,_______ was the lower earner?a)Organization Ab)Organization BCorrect answer is option 'B'. Can you explain this answer? defined & explained in the simplest way possible. Besides giving the explanation of
The following figure shows the day by day earnings of two different organizations (i.e., A and B) in a week. The vertical line is showing the amount earned in dollars and the horizontal line is showing the days of the week. Analyzing the graph shown below answer the questions given.Q.Considering the trends in days Monday, Tuesday and Friday,_______ was the lower earner?a)Organization Ab)Organization BCorrect answer is option 'B'. Can you explain this answer?, a detailed solution for The following figure shows the day by day earnings of two different organizations (i.e., A and B) in a week. The vertical line is showing the amount earned in dollars and the horizontal line is showing the days of the week. Analyzing the graph shown below answer the questions given.Q.Considering the trends in days Monday, Tuesday and Friday,_______ was the lower earner?a)Organization Ab)Organization BCorrect answer is option 'B'. Can you explain this answer? has been provided alongside types of The following figure shows the day by day earnings of two different organizations (i.e., A and B) in a week. The vertical line is showing the amount earned in dollars and the horizontal line is showing the days of the week. Analyzing the graph shown below answer the questions given.Q.Considering the trends in days Monday, Tuesday and Friday,_______ was the lower earner?a)Organization Ab)Organization BCorrect answer is option 'B'. Can you explain this answer? theory, EduRev gives you an
ample number of questions to practice The following figure shows the day by day earnings of two different organizations (i.e., A and B) in a week. The vertical line is showing the amount earned in dollars and the horizontal line is showing the days of the week. Analyzing the graph shown below answer the questions given.Q.Considering the trends in days Monday, Tuesday and Friday,_______ was the lower earner?a)Organization Ab)Organization BCorrect answer is option 'B'. Can you explain this answer? tests, examples and also practice GMAT tests.
|
|
Explore Courses for GMAT exam
|
|

Signup for Free!
Signup to see your scores go up within 7 days! Learn & Practice with 1000+ FREE Notes, Videos & Tests.
|
© EduRev
|
Education Revolution
|


|


Signup to see your scores
go up
within 7 days!
within 7 days!
Takes less than 10 seconds to signup