CAT Exam > CAT Questions > Worst Price, a leadi...
Start Learning for Free
Worst Price, a leading retailer, was running a special sales promotion at its outlet in which, for every 1000 rupees that a customer spent on buying any items at the shop, the customer would get 1 reward point. The marketing department classified the total number of customers into seven different sections – G1, G2, G3,G4, G5, G6, G7 according to their respective number of reward point. The following pie chart gives the percentage wise break up of the number of customers classified into each of these seven sections. In the pie chart, the values given in the brackets alongside each section give the minimum and maximum number of reward point got by any customer classified into that section.
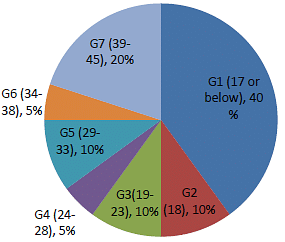
To encourage customers to spend more at their outlets the management decided to give cash return to some of the customers from among whose who had at least 18 reward points. While deciding the cash return the management decided to classify the customers with different reward points into different groups-P to U- according to their number of reward points , as given in the table below:
| Group | No. of reward point | Cash Return (Rs.) |
| P | 18,19,20 | 1000 |
| Q | 21,22,23,24,25 | 1200 |
| R | 26,27,28,29,30 | 1400 |
| S | 31,32,33,34,35 | 1600 |
| T | 36,37,38,39,40 | 1800 |
| U | 41,42,43,44,45 | 2000 |
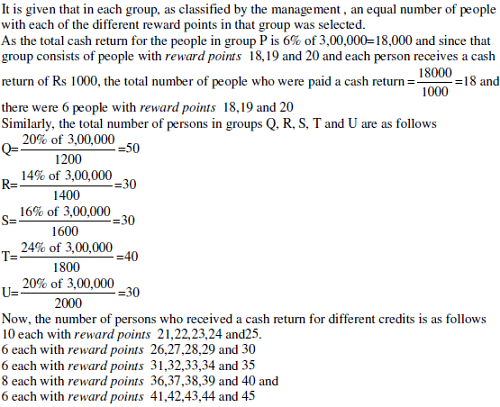
The number of customers selected for receiving a cash return were different for different groups However, within each group, the management selected an equal number of customers with each of the different number of reward points classified into that group. For example, in group P, of the total number of customers selected for receiving a cash return, the number of customers with 18 reward points is same as that with 19 reward points, which, in turn, is same as that with 20 reward points.
The percentage wise distribution of the total value of the cash returns offered by the management to the customers belonging to the different groups is given in the following graph:
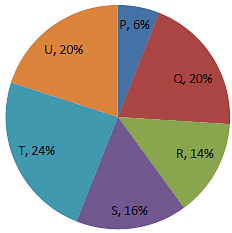
Total amount paid as cash return Rs. 300000
What percentage of the total amount paid as cash- return was to customers with at least 30 and at most 32 reward points?
- a)
- b)
- c)
- d)
Correct answer is option 'A'. Can you explain this answer?
| FREE This question is part of | Download PDF Attempt this Test |

|
Explore Courses for CAT exam
|

|
Similar CAT Doubts
Worst Price, a leading retailer, was running a special sales promotion at its outlet in which, for every 1000 rupees that a customer spent on buying any items at the shop, the customer would get 1 reward point. The marketing department classified the total number of customers into seven different sections – G1, G2, G3,G4, G5, G6, G7 according to their respective number of reward point. The following pie chart gives the percentage wise break up of the number of customers classified into each of these seven sections. In the pie chart, the values given in the brackets alongside each section give the minimum and maximum number of reward point got by any customer classified into that section. To encourage customers to spend more at their outlets the management decided to give cash return to some of the customers from among whose who had at least 18 reward points. While deciding the cash return the management decided to classify the customers with different reward points into different groups-P to U- according to their number of reward points , as given in the table below: Group No. of reward point Cash Return (Rs.) P 18,19,20 1000 Q 21,22,23,24,25 1200 R 26,27,28,29,30 1400 S 31,32,33,34,35 1600 T 36,37,38,39,40 1800 U 41,42,43,44,45 2000 The number of customers selected for receiving a cash return were different for different groups However, within each group, the management selected an equal number of customers with each of the different number of reward points classified into that group. For example, in group P, of the total number of customers selected for receiving a cash return, the number of customers with 18 reward points is same as that with 19 reward points, which, in turn, is same as that with 20 reward points. The percentage wise distribution of the total value of the cash returns offered by the management to the customers belonging to the different groups is given in the following graph: Total amount paid as cash return Rs. 300000 What percentage of the total amount paid as cash- return was to customers with at least 30 and at most 32 reward points? a) 9.2% b) 13.8% c) 15.2% d) 17.3% Correct answer is option 'A'. Can you explain this answer?
Question Description
Worst Price, a leading retailer, was running a special sales promotion at its outlet in which, for every 1000 rupees that a customer spent on buying any items at the shop, the customer would get 1 reward point. The marketing department classified the total number of customers into seven different sections – G1, G2, G3,G4, G5, G6, G7 according to their respective number of reward point. The following pie chart gives the percentage wise break up of the number of customers classified into each of these seven sections. In the pie chart, the values given in the brackets alongside each section give the minimum and maximum number of reward point got by any customer classified into that section. To encourage customers to spend more at their outlets the management decided to give cash return to some of the customers from among whose who had at least 18 reward points. While deciding the cash return the management decided to classify the customers with different reward points into different groups-P to U- according to their number of reward points , as given in the table below: Group No. of reward point Cash Return (Rs.) P 18,19,20 1000 Q 21,22,23,24,25 1200 R 26,27,28,29,30 1400 S 31,32,33,34,35 1600 T 36,37,38,39,40 1800 U 41,42,43,44,45 2000 The number of customers selected for receiving a cash return were different for different groups However, within each group, the management selected an equal number of customers with each of the different number of reward points classified into that group. For example, in group P, of the total number of customers selected for receiving a cash return, the number of customers with 18 reward points is same as that with 19 reward points, which, in turn, is same as that with 20 reward points. The percentage wise distribution of the total value of the cash returns offered by the management to the customers belonging to the different groups is given in the following graph: Total amount paid as cash return Rs. 300000 What percentage of the total amount paid as cash- return was to customers with at least 30 and at most 32 reward points? a) 9.2% b) 13.8% c) 15.2% d) 17.3% Correct answer is option 'A'. Can you explain this answer? for CAT 2024 is part of CAT preparation. The Question and answers have been prepared according to the CAT exam syllabus. Information about Worst Price, a leading retailer, was running a special sales promotion at its outlet in which, for every 1000 rupees that a customer spent on buying any items at the shop, the customer would get 1 reward point. The marketing department classified the total number of customers into seven different sections – G1, G2, G3,G4, G5, G6, G7 according to their respective number of reward point. The following pie chart gives the percentage wise break up of the number of customers classified into each of these seven sections. In the pie chart, the values given in the brackets alongside each section give the minimum and maximum number of reward point got by any customer classified into that section. To encourage customers to spend more at their outlets the management decided to give cash return to some of the customers from among whose who had at least 18 reward points. While deciding the cash return the management decided to classify the customers with different reward points into different groups-P to U- according to their number of reward points , as given in the table below: Group No. of reward point Cash Return (Rs.) P 18,19,20 1000 Q 21,22,23,24,25 1200 R 26,27,28,29,30 1400 S 31,32,33,34,35 1600 T 36,37,38,39,40 1800 U 41,42,43,44,45 2000 The number of customers selected for receiving a cash return were different for different groups However, within each group, the management selected an equal number of customers with each of the different number of reward points classified into that group. For example, in group P, of the total number of customers selected for receiving a cash return, the number of customers with 18 reward points is same as that with 19 reward points, which, in turn, is same as that with 20 reward points. The percentage wise distribution of the total value of the cash returns offered by the management to the customers belonging to the different groups is given in the following graph: Total amount paid as cash return Rs. 300000 What percentage of the total amount paid as cash- return was to customers with at least 30 and at most 32 reward points? a) 9.2% b) 13.8% c) 15.2% d) 17.3% Correct answer is option 'A'. Can you explain this answer? covers all topics & solutions for CAT 2024 Exam. Find important definitions, questions, meanings, examples, exercises and tests below for Worst Price, a leading retailer, was running a special sales promotion at its outlet in which, for every 1000 rupees that a customer spent on buying any items at the shop, the customer would get 1 reward point. The marketing department classified the total number of customers into seven different sections – G1, G2, G3,G4, G5, G6, G7 according to their respective number of reward point. The following pie chart gives the percentage wise break up of the number of customers classified into each of these seven sections. In the pie chart, the values given in the brackets alongside each section give the minimum and maximum number of reward point got by any customer classified into that section. To encourage customers to spend more at their outlets the management decided to give cash return to some of the customers from among whose who had at least 18 reward points. While deciding the cash return the management decided to classify the customers with different reward points into different groups-P to U- according to their number of reward points , as given in the table below: Group No. of reward point Cash Return (Rs.) P 18,19,20 1000 Q 21,22,23,24,25 1200 R 26,27,28,29,30 1400 S 31,32,33,34,35 1600 T 36,37,38,39,40 1800 U 41,42,43,44,45 2000 The number of customers selected for receiving a cash return were different for different groups However, within each group, the management selected an equal number of customers with each of the different number of reward points classified into that group. For example, in group P, of the total number of customers selected for receiving a cash return, the number of customers with 18 reward points is same as that with 19 reward points, which, in turn, is same as that with 20 reward points. The percentage wise distribution of the total value of the cash returns offered by the management to the customers belonging to the different groups is given in the following graph: Total amount paid as cash return Rs. 300000 What percentage of the total amount paid as cash- return was to customers with at least 30 and at most 32 reward points? a) 9.2% b) 13.8% c) 15.2% d) 17.3% Correct answer is option 'A'. Can you explain this answer?.
Worst Price, a leading retailer, was running a special sales promotion at its outlet in which, for every 1000 rupees that a customer spent on buying any items at the shop, the customer would get 1 reward point. The marketing department classified the total number of customers into seven different sections – G1, G2, G3,G4, G5, G6, G7 according to their respective number of reward point. The following pie chart gives the percentage wise break up of the number of customers classified into each of these seven sections. In the pie chart, the values given in the brackets alongside each section give the minimum and maximum number of reward point got by any customer classified into that section. To encourage customers to spend more at their outlets the management decided to give cash return to some of the customers from among whose who had at least 18 reward points. While deciding the cash return the management decided to classify the customers with different reward points into different groups-P to U- according to their number of reward points , as given in the table below: Group No. of reward point Cash Return (Rs.) P 18,19,20 1000 Q 21,22,23,24,25 1200 R 26,27,28,29,30 1400 S 31,32,33,34,35 1600 T 36,37,38,39,40 1800 U 41,42,43,44,45 2000 The number of customers selected for receiving a cash return were different for different groups However, within each group, the management selected an equal number of customers with each of the different number of reward points classified into that group. For example, in group P, of the total number of customers selected for receiving a cash return, the number of customers with 18 reward points is same as that with 19 reward points, which, in turn, is same as that with 20 reward points. The percentage wise distribution of the total value of the cash returns offered by the management to the customers belonging to the different groups is given in the following graph: Total amount paid as cash return Rs. 300000 What percentage of the total amount paid as cash- return was to customers with at least 30 and at most 32 reward points? a) 9.2% b) 13.8% c) 15.2% d) 17.3% Correct answer is option 'A'. Can you explain this answer? for CAT 2024 is part of CAT preparation. The Question and answers have been prepared according to the CAT exam syllabus. Information about Worst Price, a leading retailer, was running a special sales promotion at its outlet in which, for every 1000 rupees that a customer spent on buying any items at the shop, the customer would get 1 reward point. The marketing department classified the total number of customers into seven different sections – G1, G2, G3,G4, G5, G6, G7 according to their respective number of reward point. The following pie chart gives the percentage wise break up of the number of customers classified into each of these seven sections. In the pie chart, the values given in the brackets alongside each section give the minimum and maximum number of reward point got by any customer classified into that section. To encourage customers to spend more at their outlets the management decided to give cash return to some of the customers from among whose who had at least 18 reward points. While deciding the cash return the management decided to classify the customers with different reward points into different groups-P to U- according to their number of reward points , as given in the table below: Group No. of reward point Cash Return (Rs.) P 18,19,20 1000 Q 21,22,23,24,25 1200 R 26,27,28,29,30 1400 S 31,32,33,34,35 1600 T 36,37,38,39,40 1800 U 41,42,43,44,45 2000 The number of customers selected for receiving a cash return were different for different groups However, within each group, the management selected an equal number of customers with each of the different number of reward points classified into that group. For example, in group P, of the total number of customers selected for receiving a cash return, the number of customers with 18 reward points is same as that with 19 reward points, which, in turn, is same as that with 20 reward points. The percentage wise distribution of the total value of the cash returns offered by the management to the customers belonging to the different groups is given in the following graph: Total amount paid as cash return Rs. 300000 What percentage of the total amount paid as cash- return was to customers with at least 30 and at most 32 reward points? a) 9.2% b) 13.8% c) 15.2% d) 17.3% Correct answer is option 'A'. Can you explain this answer? covers all topics & solutions for CAT 2024 Exam. Find important definitions, questions, meanings, examples, exercises and tests below for Worst Price, a leading retailer, was running a special sales promotion at its outlet in which, for every 1000 rupees that a customer spent on buying any items at the shop, the customer would get 1 reward point. The marketing department classified the total number of customers into seven different sections – G1, G2, G3,G4, G5, G6, G7 according to their respective number of reward point. The following pie chart gives the percentage wise break up of the number of customers classified into each of these seven sections. In the pie chart, the values given in the brackets alongside each section give the minimum and maximum number of reward point got by any customer classified into that section. To encourage customers to spend more at their outlets the management decided to give cash return to some of the customers from among whose who had at least 18 reward points. While deciding the cash return the management decided to classify the customers with different reward points into different groups-P to U- according to their number of reward points , as given in the table below: Group No. of reward point Cash Return (Rs.) P 18,19,20 1000 Q 21,22,23,24,25 1200 R 26,27,28,29,30 1400 S 31,32,33,34,35 1600 T 36,37,38,39,40 1800 U 41,42,43,44,45 2000 The number of customers selected for receiving a cash return were different for different groups However, within each group, the management selected an equal number of customers with each of the different number of reward points classified into that group. For example, in group P, of the total number of customers selected for receiving a cash return, the number of customers with 18 reward points is same as that with 19 reward points, which, in turn, is same as that with 20 reward points. The percentage wise distribution of the total value of the cash returns offered by the management to the customers belonging to the different groups is given in the following graph: Total amount paid as cash return Rs. 300000 What percentage of the total amount paid as cash- return was to customers with at least 30 and at most 32 reward points? a) 9.2% b) 13.8% c) 15.2% d) 17.3% Correct answer is option 'A'. Can you explain this answer?.
Solutions for Worst Price, a leading retailer, was running a special sales promotion at its outlet in which, for every 1000 rupees that a customer spent on buying any items at the shop, the customer would get 1 reward point. The marketing department classified the total number of customers into seven different sections – G1, G2, G3,G4, G5, G6, G7 according to their respective number of reward point. The following pie chart gives the percentage wise break up of the number of customers classified into each of these seven sections. In the pie chart, the values given in the brackets alongside each section give the minimum and maximum number of reward point got by any customer classified into that section. To encourage customers to spend more at their outlets the management decided to give cash return to some of the customers from among whose who had at least 18 reward points. While deciding the cash return the management decided to classify the customers with different reward points into different groups-P to U- according to their number of reward points , as given in the table below: Group No. of reward point Cash Return (Rs.) P 18,19,20 1000 Q 21,22,23,24,25 1200 R 26,27,28,29,30 1400 S 31,32,33,34,35 1600 T 36,37,38,39,40 1800 U 41,42,43,44,45 2000 The number of customers selected for receiving a cash return were different for different groups However, within each group, the management selected an equal number of customers with each of the different number of reward points classified into that group. For example, in group P, of the total number of customers selected for receiving a cash return, the number of customers with 18 reward points is same as that with 19 reward points, which, in turn, is same as that with 20 reward points. The percentage wise distribution of the total value of the cash returns offered by the management to the customers belonging to the different groups is given in the following graph: Total amount paid as cash return Rs. 300000 What percentage of the total amount paid as cash- return was to customers with at least 30 and at most 32 reward points? a) 9.2% b) 13.8% c) 15.2% d) 17.3% Correct answer is option 'A'. Can you explain this answer? in English & in Hindi are available as part of our courses for CAT.
Download more important topics, notes, lectures and mock test series for CAT Exam by signing up for free.
Here you can find the meaning of Worst Price, a leading retailer, was running a special sales promotion at its outlet in which, for every 1000 rupees that a customer spent on buying any items at the shop, the customer would get 1 reward point. The marketing department classified the total number of customers into seven different sections – G1, G2, G3,G4, G5, G6, G7 according to their respective number of reward point. The following pie chart gives the percentage wise break up of the number of customers classified into each of these seven sections. In the pie chart, the values given in the brackets alongside each section give the minimum and maximum number of reward point got by any customer classified into that section. To encourage customers to spend more at their outlets the management decided to give cash return to some of the customers from among whose who had at least 18 reward points. While deciding the cash return the management decided to classify the customers with different reward points into different groups-P to U- according to their number of reward points , as given in the table below: Group No. of reward point Cash Return (Rs.) P 18,19,20 1000 Q 21,22,23,24,25 1200 R 26,27,28,29,30 1400 S 31,32,33,34,35 1600 T 36,37,38,39,40 1800 U 41,42,43,44,45 2000 The number of customers selected for receiving a cash return were different for different groups However, within each group, the management selected an equal number of customers with each of the different number of reward points classified into that group. For example, in group P, of the total number of customers selected for receiving a cash return, the number of customers with 18 reward points is same as that with 19 reward points, which, in turn, is same as that with 20 reward points. The percentage wise distribution of the total value of the cash returns offered by the management to the customers belonging to the different groups is given in the following graph: Total amount paid as cash return Rs. 300000 What percentage of the total amount paid as cash- return was to customers with at least 30 and at most 32 reward points? a) 9.2% b) 13.8% c) 15.2% d) 17.3% Correct answer is option 'A'. Can you explain this answer? defined & explained in the simplest way possible. Besides giving the explanation of
Worst Price, a leading retailer, was running a special sales promotion at its outlet in which, for every 1000 rupees that a customer spent on buying any items at the shop, the customer would get 1 reward point. The marketing department classified the total number of customers into seven different sections – G1, G2, G3,G4, G5, G6, G7 according to their respective number of reward point. The following pie chart gives the percentage wise break up of the number of customers classified into each of these seven sections. In the pie chart, the values given in the brackets alongside each section give the minimum and maximum number of reward point got by any customer classified into that section. To encourage customers to spend more at their outlets the management decided to give cash return to some of the customers from among whose who had at least 18 reward points. While deciding the cash return the management decided to classify the customers with different reward points into different groups-P to U- according to their number of reward points , as given in the table below: Group No. of reward point Cash Return (Rs.) P 18,19,20 1000 Q 21,22,23,24,25 1200 R 26,27,28,29,30 1400 S 31,32,33,34,35 1600 T 36,37,38,39,40 1800 U 41,42,43,44,45 2000 The number of customers selected for receiving a cash return were different for different groups However, within each group, the management selected an equal number of customers with each of the different number of reward points classified into that group. For example, in group P, of the total number of customers selected for receiving a cash return, the number of customers with 18 reward points is same as that with 19 reward points, which, in turn, is same as that with 20 reward points. The percentage wise distribution of the total value of the cash returns offered by the management to the customers belonging to the different groups is given in the following graph: Total amount paid as cash return Rs. 300000 What percentage of the total amount paid as cash- return was to customers with at least 30 and at most 32 reward points? a) 9.2% b) 13.8% c) 15.2% d) 17.3% Correct answer is option 'A'. Can you explain this answer?, a detailed solution for Worst Price, a leading retailer, was running a special sales promotion at its outlet in which, for every 1000 rupees that a customer spent on buying any items at the shop, the customer would get 1 reward point. The marketing department classified the total number of customers into seven different sections – G1, G2, G3,G4, G5, G6, G7 according to their respective number of reward point. The following pie chart gives the percentage wise break up of the number of customers classified into each of these seven sections. In the pie chart, the values given in the brackets alongside each section give the minimum and maximum number of reward point got by any customer classified into that section. To encourage customers to spend more at their outlets the management decided to give cash return to some of the customers from among whose who had at least 18 reward points. While deciding the cash return the management decided to classify the customers with different reward points into different groups-P to U- according to their number of reward points , as given in the table below: Group No. of reward point Cash Return (Rs.) P 18,19,20 1000 Q 21,22,23,24,25 1200 R 26,27,28,29,30 1400 S 31,32,33,34,35 1600 T 36,37,38,39,40 1800 U 41,42,43,44,45 2000 The number of customers selected for receiving a cash return were different for different groups However, within each group, the management selected an equal number of customers with each of the different number of reward points classified into that group. For example, in group P, of the total number of customers selected for receiving a cash return, the number of customers with 18 reward points is same as that with 19 reward points, which, in turn, is same as that with 20 reward points. The percentage wise distribution of the total value of the cash returns offered by the management to the customers belonging to the different groups is given in the following graph: Total amount paid as cash return Rs. 300000 What percentage of the total amount paid as cash- return was to customers with at least 30 and at most 32 reward points? a) 9.2% b) 13.8% c) 15.2% d) 17.3% Correct answer is option 'A'. Can you explain this answer? has been provided alongside types of Worst Price, a leading retailer, was running a special sales promotion at its outlet in which, for every 1000 rupees that a customer spent on buying any items at the shop, the customer would get 1 reward point. The marketing department classified the total number of customers into seven different sections – G1, G2, G3,G4, G5, G6, G7 according to their respective number of reward point. The following pie chart gives the percentage wise break up of the number of customers classified into each of these seven sections. In the pie chart, the values given in the brackets alongside each section give the minimum and maximum number of reward point got by any customer classified into that section. To encourage customers to spend more at their outlets the management decided to give cash return to some of the customers from among whose who had at least 18 reward points. While deciding the cash return the management decided to classify the customers with different reward points into different groups-P to U- according to their number of reward points , as given in the table below: Group No. of reward point Cash Return (Rs.) P 18,19,20 1000 Q 21,22,23,24,25 1200 R 26,27,28,29,30 1400 S 31,32,33,34,35 1600 T 36,37,38,39,40 1800 U 41,42,43,44,45 2000 The number of customers selected for receiving a cash return were different for different groups However, within each group, the management selected an equal number of customers with each of the different number of reward points classified into that group. For example, in group P, of the total number of customers selected for receiving a cash return, the number of customers with 18 reward points is same as that with 19 reward points, which, in turn, is same as that with 20 reward points. The percentage wise distribution of the total value of the cash returns offered by the management to the customers belonging to the different groups is given in the following graph: Total amount paid as cash return Rs. 300000 What percentage of the total amount paid as cash- return was to customers with at least 30 and at most 32 reward points? a) 9.2% b) 13.8% c) 15.2% d) 17.3% Correct answer is option 'A'. Can you explain this answer? theory, EduRev gives you an
ample number of questions to practice Worst Price, a leading retailer, was running a special sales promotion at its outlet in which, for every 1000 rupees that a customer spent on buying any items at the shop, the customer would get 1 reward point. The marketing department classified the total number of customers into seven different sections – G1, G2, G3,G4, G5, G6, G7 according to their respective number of reward point. The following pie chart gives the percentage wise break up of the number of customers classified into each of these seven sections. In the pie chart, the values given in the brackets alongside each section give the minimum and maximum number of reward point got by any customer classified into that section. To encourage customers to spend more at their outlets the management decided to give cash return to some of the customers from among whose who had at least 18 reward points. While deciding the cash return the management decided to classify the customers with different reward points into different groups-P to U- according to their number of reward points , as given in the table below: Group No. of reward point Cash Return (Rs.) P 18,19,20 1000 Q 21,22,23,24,25 1200 R 26,27,28,29,30 1400 S 31,32,33,34,35 1600 T 36,37,38,39,40 1800 U 41,42,43,44,45 2000 The number of customers selected for receiving a cash return were different for different groups However, within each group, the management selected an equal number of customers with each of the different number of reward points classified into that group. For example, in group P, of the total number of customers selected for receiving a cash return, the number of customers with 18 reward points is same as that with 19 reward points, which, in turn, is same as that with 20 reward points. The percentage wise distribution of the total value of the cash returns offered by the management to the customers belonging to the different groups is given in the following graph: Total amount paid as cash return Rs. 300000 What percentage of the total amount paid as cash- return was to customers with at least 30 and at most 32 reward points? a) 9.2% b) 13.8% c) 15.2% d) 17.3% Correct answer is option 'A'. Can you explain this answer? tests, examples and also practice CAT tests.

|
Explore Courses for CAT exam
|

|
Suggested Free Tests
Signup for Free!
Signup to see your scores go up within 7 days! Learn & Practice with 1000+ FREE Notes, Videos & Tests.

