


Class 11 Exam > Class 11 Questions > Figure shown is a graph, at a certain time t,...
Start Learning for Free
Figure shown is a graph, at a certain time t, of the displacement function S ( x, t ) of three sound waves 1,2 and 3 as marked on the curves that travel along x-axis through air. If P1, P2 and P3 represent their pressure oscillation amplitudes respectively, then correct relation between them is:
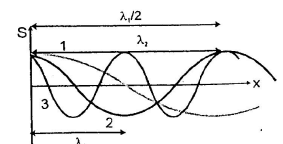
- a)P1 > P2 > P3
- b)P3 > P2 > P1
- c)P1 = P2 = P3
- d)P2 > P3 > P1
Correct answer is option 'B'. Can you explain this answer?

Verified Answer
Figure shown is a graph, at a certain time t, of the displacement func...
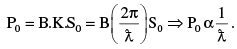
Thus pressure amplitude is highest for minimum wavelength, other parameters B and S0 being same


|
Explore Courses for Class 11 exam
|
|
Top Courses for Class 11View all


Question Description
Figure shown is a graph, at a certain time t, of the displacement function S ( x, t ) of three sound waves 1,2 and 3 as marked on the curves that travel along x-axis through air. If P1, P2 and P3 represent their pressure oscillation amplitudes respectively, then correct relation between them is: a)P1 > P2 > P3b)P3 > P2 > P1c)P1 = P2 = P3d)P2 > P3 > P1Correct answer is option 'B'. Can you explain this answer? for Class 11 2025 is part of Class 11 preparation. The Question and answers have been prepared according to the Class 11 exam syllabus. Information about Figure shown is a graph, at a certain time t, of the displacement function S ( x, t ) of three sound waves 1,2 and 3 as marked on the curves that travel along x-axis through air. If P1, P2 and P3 represent their pressure oscillation amplitudes respectively, then correct relation between them is: a)P1 > P2 > P3b)P3 > P2 > P1c)P1 = P2 = P3d)P2 > P3 > P1Correct answer is option 'B'. Can you explain this answer? covers all topics & solutions for Class 11 2025 Exam. Find important definitions, questions, meanings, examples, exercises and tests below for Figure shown is a graph, at a certain time t, of the displacement function S ( x, t ) of three sound waves 1,2 and 3 as marked on the curves that travel along x-axis through air. If P1, P2 and P3 represent their pressure oscillation amplitudes respectively, then correct relation between them is: a)P1 > P2 > P3b)P3 > P2 > P1c)P1 = P2 = P3d)P2 > P3 > P1Correct answer is option 'B'. Can you explain this answer?.
Figure shown is a graph, at a certain time t, of the displacement function S ( x, t ) of three sound waves 1,2 and 3 as marked on the curves that travel along x-axis through air. If P1, P2 and P3 represent their pressure oscillation amplitudes respectively, then correct relation between them is: a)P1 > P2 > P3b)P3 > P2 > P1c)P1 = P2 = P3d)P2 > P3 > P1Correct answer is option 'B'. Can you explain this answer? for Class 11 2025 is part of Class 11 preparation. The Question and answers have been prepared according to the Class 11 exam syllabus. Information about Figure shown is a graph, at a certain time t, of the displacement function S ( x, t ) of three sound waves 1,2 and 3 as marked on the curves that travel along x-axis through air. If P1, P2 and P3 represent their pressure oscillation amplitudes respectively, then correct relation between them is: a)P1 > P2 > P3b)P3 > P2 > P1c)P1 = P2 = P3d)P2 > P3 > P1Correct answer is option 'B'. Can you explain this answer? covers all topics & solutions for Class 11 2025 Exam. Find important definitions, questions, meanings, examples, exercises and tests below for Figure shown is a graph, at a certain time t, of the displacement function S ( x, t ) of three sound waves 1,2 and 3 as marked on the curves that travel along x-axis through air. If P1, P2 and P3 represent their pressure oscillation amplitudes respectively, then correct relation between them is: a)P1 > P2 > P3b)P3 > P2 > P1c)P1 = P2 = P3d)P2 > P3 > P1Correct answer is option 'B'. Can you explain this answer?.
Solutions for Figure shown is a graph, at a certain time t, of the displacement function S ( x, t ) of three sound waves 1,2 and 3 as marked on the curves that travel along x-axis through air. If P1, P2 and P3 represent their pressure oscillation amplitudes respectively, then correct relation between them is: a)P1 > P2 > P3b)P3 > P2 > P1c)P1 = P2 = P3d)P2 > P3 > P1Correct answer is option 'B'. Can you explain this answer? in English & in Hindi are available as part of our courses for Class 11.
Download more important topics, notes, lectures and mock test series for Class 11 Exam by signing up for free.
Here you can find the meaning of Figure shown is a graph, at a certain time t, of the displacement function S ( x, t ) of three sound waves 1,2 and 3 as marked on the curves that travel along x-axis through air. If P1, P2 and P3 represent their pressure oscillation amplitudes respectively, then correct relation between them is: a)P1 > P2 > P3b)P3 > P2 > P1c)P1 = P2 = P3d)P2 > P3 > P1Correct answer is option 'B'. Can you explain this answer? defined & explained in the simplest way possible. Besides giving the explanation of
Figure shown is a graph, at a certain time t, of the displacement function S ( x, t ) of three sound waves 1,2 and 3 as marked on the curves that travel along x-axis through air. If P1, P2 and P3 represent their pressure oscillation amplitudes respectively, then correct relation between them is: a)P1 > P2 > P3b)P3 > P2 > P1c)P1 = P2 = P3d)P2 > P3 > P1Correct answer is option 'B'. Can you explain this answer?, a detailed solution for Figure shown is a graph, at a certain time t, of the displacement function S ( x, t ) of three sound waves 1,2 and 3 as marked on the curves that travel along x-axis through air. If P1, P2 and P3 represent their pressure oscillation amplitudes respectively, then correct relation between them is: a)P1 > P2 > P3b)P3 > P2 > P1c)P1 = P2 = P3d)P2 > P3 > P1Correct answer is option 'B'. Can you explain this answer? has been provided alongside types of Figure shown is a graph, at a certain time t, of the displacement function S ( x, t ) of three sound waves 1,2 and 3 as marked on the curves that travel along x-axis through air. If P1, P2 and P3 represent their pressure oscillation amplitudes respectively, then correct relation between them is: a)P1 > P2 > P3b)P3 > P2 > P1c)P1 = P2 = P3d)P2 > P3 > P1Correct answer is option 'B'. Can you explain this answer? theory, EduRev gives you an
ample number of questions to practice Figure shown is a graph, at a certain time t, of the displacement function S ( x, t ) of three sound waves 1,2 and 3 as marked on the curves that travel along x-axis through air. If P1, P2 and P3 represent their pressure oscillation amplitudes respectively, then correct relation between them is: a)P1 > P2 > P3b)P3 > P2 > P1c)P1 = P2 = P3d)P2 > P3 > P1Correct answer is option 'B'. Can you explain this answer? tests, examples and also practice Class 11 tests.
|
|
Explore Courses for Class 11 exam
|
|

Signup for Free!
Signup to see your scores go up within 7 days! Learn & Practice with 1000+ FREE Notes, Videos & Tests.
|
© EduRev
|
Education Revolution
|


|


Signup to see your scores
go up
within 7 days!
within 7 days!
Takes less than 10 seconds to signup