


JEE Exam > JEE Questions > Two stones are thrown up simultaneously from ...
Start Learning for Free
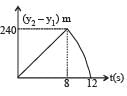
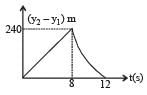
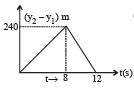
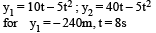
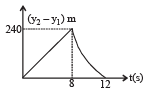
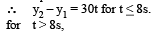
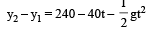
Two stones are thrown up simultaneously from the edge of a cliff 240 m high with initial speed of 10 m/s and 40 m/s respectively. Which of the following graph best represents the time variation of relative position of the second stone with respect to the first ? (Assume stones do not rebound after hitting the ground and neglect air resistance, take g = 10 m/ s2) (The figures are schematic and not drawn to scale)
- a)
- b)
- c)
- d)
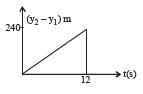
Correct answer is option 'B'. Can you explain this answer?

Verified Answer
Two stones are thrown up simultaneously from the edge of a cliff 240 m...

|
Explore Courses for JEE exam
|
|
Top Courses for JEEView all


Question Description
Two stones are thrown up simultaneously from the edge of a cliff 240 m high with initial speed of 10 m/s and 40 m/s respectively. Which of the following graph best represents the time variation of relative position of the second stone with respect to the first ? (Assume stones do not rebound after hitting the ground and neglect air resistance, take g = 10 m/ s2) (The figures are schematic and not drawn to scale)a)b)c)d)Correct answer is option 'B'. Can you explain this answer? for JEE 2025 is part of JEE preparation. The Question and answers have been prepared according to the JEE exam syllabus. Information about Two stones are thrown up simultaneously from the edge of a cliff 240 m high with initial speed of 10 m/s and 40 m/s respectively. Which of the following graph best represents the time variation of relative position of the second stone with respect to the first ? (Assume stones do not rebound after hitting the ground and neglect air resistance, take g = 10 m/ s2) (The figures are schematic and not drawn to scale)a)b)c)d)Correct answer is option 'B'. Can you explain this answer? covers all topics & solutions for JEE 2025 Exam. Find important definitions, questions, meanings, examples, exercises and tests below for Two stones are thrown up simultaneously from the edge of a cliff 240 m high with initial speed of 10 m/s and 40 m/s respectively. Which of the following graph best represents the time variation of relative position of the second stone with respect to the first ? (Assume stones do not rebound after hitting the ground and neglect air resistance, take g = 10 m/ s2) (The figures are schematic and not drawn to scale)a)b)c)d)Correct answer is option 'B'. Can you explain this answer?.
Two stones are thrown up simultaneously from the edge of a cliff 240 m high with initial speed of 10 m/s and 40 m/s respectively. Which of the following graph best represents the time variation of relative position of the second stone with respect to the first ? (Assume stones do not rebound after hitting the ground and neglect air resistance, take g = 10 m/ s2) (The figures are schematic and not drawn to scale)a)b)c)d)Correct answer is option 'B'. Can you explain this answer? for JEE 2025 is part of JEE preparation. The Question and answers have been prepared according to the JEE exam syllabus. Information about Two stones are thrown up simultaneously from the edge of a cliff 240 m high with initial speed of 10 m/s and 40 m/s respectively. Which of the following graph best represents the time variation of relative position of the second stone with respect to the first ? (Assume stones do not rebound after hitting the ground and neglect air resistance, take g = 10 m/ s2) (The figures are schematic and not drawn to scale)a)b)c)d)Correct answer is option 'B'. Can you explain this answer? covers all topics & solutions for JEE 2025 Exam. Find important definitions, questions, meanings, examples, exercises and tests below for Two stones are thrown up simultaneously from the edge of a cliff 240 m high with initial speed of 10 m/s and 40 m/s respectively. Which of the following graph best represents the time variation of relative position of the second stone with respect to the first ? (Assume stones do not rebound after hitting the ground and neglect air resistance, take g = 10 m/ s2) (The figures are schematic and not drawn to scale)a)b)c)d)Correct answer is option 'B'. Can you explain this answer?.
Solutions for Two stones are thrown up simultaneously from the edge of a cliff 240 m high with initial speed of 10 m/s and 40 m/s respectively. Which of the following graph best represents the time variation of relative position of the second stone with respect to the first ? (Assume stones do not rebound after hitting the ground and neglect air resistance, take g = 10 m/ s2) (The figures are schematic and not drawn to scale)a)b)c)d)Correct answer is option 'B'. Can you explain this answer? in English & in Hindi are available as part of our courses for JEE.
Download more important topics, notes, lectures and mock test series for JEE Exam by signing up for free.
Here you can find the meaning of Two stones are thrown up simultaneously from the edge of a cliff 240 m high with initial speed of 10 m/s and 40 m/s respectively. Which of the following graph best represents the time variation of relative position of the second stone with respect to the first ? (Assume stones do not rebound after hitting the ground and neglect air resistance, take g = 10 m/ s2) (The figures are schematic and not drawn to scale)a)b)c)d)Correct answer is option 'B'. Can you explain this answer? defined & explained in the simplest way possible. Besides giving the explanation of
Two stones are thrown up simultaneously from the edge of a cliff 240 m high with initial speed of 10 m/s and 40 m/s respectively. Which of the following graph best represents the time variation of relative position of the second stone with respect to the first ? (Assume stones do not rebound after hitting the ground and neglect air resistance, take g = 10 m/ s2) (The figures are schematic and not drawn to scale)a)b)c)d)Correct answer is option 'B'. Can you explain this answer?, a detailed solution for Two stones are thrown up simultaneously from the edge of a cliff 240 m high with initial speed of 10 m/s and 40 m/s respectively. Which of the following graph best represents the time variation of relative position of the second stone with respect to the first ? (Assume stones do not rebound after hitting the ground and neglect air resistance, take g = 10 m/ s2) (The figures are schematic and not drawn to scale)a)b)c)d)Correct answer is option 'B'. Can you explain this answer? has been provided alongside types of Two stones are thrown up simultaneously from the edge of a cliff 240 m high with initial speed of 10 m/s and 40 m/s respectively. Which of the following graph best represents the time variation of relative position of the second stone with respect to the first ? (Assume stones do not rebound after hitting the ground and neglect air resistance, take g = 10 m/ s2) (The figures are schematic and not drawn to scale)a)b)c)d)Correct answer is option 'B'. Can you explain this answer? theory, EduRev gives you an
ample number of questions to practice Two stones are thrown up simultaneously from the edge of a cliff 240 m high with initial speed of 10 m/s and 40 m/s respectively. Which of the following graph best represents the time variation of relative position of the second stone with respect to the first ? (Assume stones do not rebound after hitting the ground and neglect air resistance, take g = 10 m/ s2) (The figures are schematic and not drawn to scale)a)b)c)d)Correct answer is option 'B'. Can you explain this answer? tests, examples and also practice JEE tests.
|
|
Explore Courses for JEE exam
|
|

Signup for Free!
Signup to see your scores go up within 7 days! Learn & Practice with 1000+ FREE Notes, Videos & Tests.


|
© EduRev
|
Education Revolution
|


|


Signup to see your scores
go up within 7 days!
Access 1000+ FREE Docs, Videos and Tests
Takes less than 10 seconds to signup