CA Foundation Exam > CA Foundation Questions > The following table provides the distribution...
Start Learning for Free
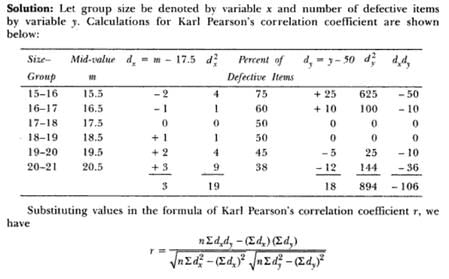
The following table provides the distribution of items according to size groups and also the number of defectives?
Verified Answer
The following table provides the distribution of items according to si...
Ans.
Method to Solve :


 This question is part of UPSC exam. View all CA Foundation courses
Most Upvoted Answer
The following table provides the distribution of items according to si...
Table: Distribution of Items According to Size Groups and Number of Defectives
| Size Group | Number of Items | Number of Defectives |
|------------|----------------|---------------------|
| Small | 100 | 5 |
| Medium | 200 | 10 |
| Large | 300 | 15 |
| Total | 600 | 30 |
Explanation:
Size Groups:
- The table provides information about the distribution of items according to size groups.
- In this case, the size groups are categorized as small, medium, and large.
Number of Items:
- The "Number of Items" column indicates the total quantity of items in each size group.
- According to the table, there are 100 items in the small size group, 200 items in the medium size group, and 300 items in the large size group.
- The total number of items in all size groups combined is 600.
Number of Defectives:
- The "Number of Defectives" column represents the count of defective items in each size group.
- In the small size group, there are 5 defective items.
- In the medium size group, there are 10 defective items.
- In the large size group, there are 15 defective items.
- The total number of defective items across all size groups is 30.
Summary:
- The table provides an overview of the distribution of items based on their size groups and the number of defectives.
- It allows us to analyze the defectiveness rate in each size group and compare across different sizes.
- For example, the large size group has the highest number of defectives (15) compared to the small (5) and medium (10) size groups.
- By examining the data in this table, we can identify patterns or trends in defectiveness based on size groups, which can be useful for quality control and improvement efforts.
Attention CA Foundation Students!
To make sure you are not studying endlessly, EduRev has designed CA Foundation study material, with Structured Courses, Videos, & Test Series. Plus get personalized analysis, doubt solving and improvement plans to achieve a great score in CA Foundation.

|
Explore Courses for CA Foundation exam
|

|
Similar CA Foundation Doubts
The following table provides the distribution of items according to size groups and also the number of defectives?
Question Description
The following table provides the distribution of items according to size groups and also the number of defectives? for CA Foundation 2024 is part of CA Foundation preparation. The Question and answers have been prepared according to the CA Foundation exam syllabus. Information about The following table provides the distribution of items according to size groups and also the number of defectives? covers all topics & solutions for CA Foundation 2024 Exam. Find important definitions, questions, meanings, examples, exercises and tests below for The following table provides the distribution of items according to size groups and also the number of defectives?.
The following table provides the distribution of items according to size groups and also the number of defectives? for CA Foundation 2024 is part of CA Foundation preparation. The Question and answers have been prepared according to the CA Foundation exam syllabus. Information about The following table provides the distribution of items according to size groups and also the number of defectives? covers all topics & solutions for CA Foundation 2024 Exam. Find important definitions, questions, meanings, examples, exercises and tests below for The following table provides the distribution of items according to size groups and also the number of defectives?.
Solutions for The following table provides the distribution of items according to size groups and also the number of defectives? in English & in Hindi are available as part of our courses for CA Foundation.
Download more important topics, notes, lectures and mock test series for CA Foundation Exam by signing up for free.
Here you can find the meaning of The following table provides the distribution of items according to size groups and also the number of defectives? defined & explained in the simplest way possible. Besides giving the explanation of
The following table provides the distribution of items according to size groups and also the number of defectives?, a detailed solution for The following table provides the distribution of items according to size groups and also the number of defectives? has been provided alongside types of The following table provides the distribution of items according to size groups and also the number of defectives? theory, EduRev gives you an
ample number of questions to practice The following table provides the distribution of items according to size groups and also the number of defectives? tests, examples and also practice CA Foundation tests.

|
Explore Courses for CA Foundation exam
|

|
Suggested Free Tests
Signup for Free!
Signup to see your scores go up within 7 days! Learn & Practice with 1000+ FREE Notes, Videos & Tests.


