


GMAT Exam > GMAT Questions > Of the 150 people in a party, 70 were women. ...
Start Learning for Free
Of the 150 people in a party, 70 were women. 30 women preferred Drink A. 50 people didn’t prefer Drink A. What was the total number of men who preferred drink A?
- a)40
- b)50
- c)60
- d)70
- e)80
Correct answer is option 'D'. Can you explain this answer?

Verified Answer
Of the 150 people in a party, 70 were women. 30 women preferred Drink ...
As there are multiple information within the question, we need to think of a way in which we can efficiently organize this information.
We can either use a Tree structure or a Venn Diagram to solve this question.
Method 1: Tree Structure
The best way here is to use a Tree structure to organize this given information.
Let’s draw our Tree structure with the given information.
- Total number of people = 150
- Number of women = 70
- Number of women who preferred Drink A = 30
- Number of people who didn’t prefer Drink A = 50
Drawing the tree structure, we get
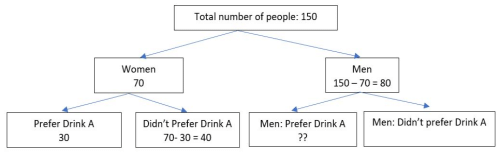
Now that we have organised information in a Tree Structure, we can easily see that
- No: of men who didn’t prefer Drink A =
- No: of people who didn’t prefer Drink A (given) – No: of women who didn’t prefer Drink A (from tree structure)
- No: of men who didn’t prefer Drink A = 50 – 40 = 10
Therefore,
Out of the 80 men, 10 men didn’t prefer Drink A.
Hence,
- Number of men who preferred Drink A = Total number of men - Number of men who didnt prefer Drink A
- Number of men who preferred Drink A = 80 – 10 = 70
Correct Answer: Option D
Method 2: Venn Diagram
We have seen that Tree Structure provides a easy way to solve this question.
We can also use a Venn Diagram to solve this question, although this requires a bit of advanced thinking with regards to appropriate selection of sets.
We are given that there are 150 people in a party of which 70 are women and 80 are men. We are given information about the preferences of these people of a drink A.
- 30 out of 70 women prefer drink A.
- This means, 40 women don’t prefer drink A.
- Now, we have to find the number of men who prefer drink A.Let us consider two sets: Women and Drink A.Therefore, our Venn Diagram will look like this:
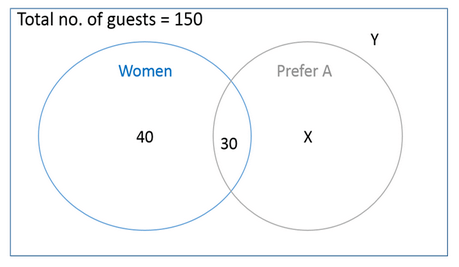
In this diagram,
- X = Number of men who prefer drink A. This is the number we need to find.
- Y = Number of men who don’t prefer drink A
Now, the sum of the number of people in all the four zones will be equal to the total number of guests at the party.
Thus,
- 40 + 30 + X + Y = 150
That is,
- X + Y = 80 . . . (1)
(Basically, Equation 1 only conveys that the number of men at the party was 80)
Finding required values
We are also given that the number of people who didn’t prefer drink A is 50.
This means,
The number of people who fall outside of the gray circle (The ‘Prefer A’ circle) is 50
Thus,
- 40 + Y = 50
- Y = 10 . . . (2)
Calculating the final answer
Substituting the value of Y in Equation (1) we get:
- X = 70
Thus, the number of men who prefer drink A is 70
Correct Answer: Option D
Most Upvoted Answer
Of the 150 people in a party, 70 were women. 30 women preferred Drink ...
As there are multiple information within the question, we need to think of a way in which we can efficiently organize this information.
We can either use a Tree structure or a Venn Diagram to solve this question.
Method 1: Tree Structure
The best way here is to use a Tree structure to organize this given information.
Let’s draw our Tree structure with the given information.
- Total number of people = 150
- Number of women = 70
- Number of women who preferred Drink A = 30
- Number of people who didn’t prefer Drink A = 50
Drawing the tree structure, we get
Now that we have organised information in a Tree Structure, we can easily see that
- No: of men who didn’t prefer Drink A =
- No: of people who didn’t prefer Drink A (given) – No: of women who didn’t prefer Drink A (from tree structure)
- No: of men who didn’t prefer Drink A = 50 – 40 = 10
Therefore,
Out of the 80 men, 10 men didn’t prefer Drink A.
Hence,
- Number of men who preferred Drink A = Total number of men - Number of men who didnt prefer Drink A
- Number of men who preferred Drink A = 80 – 10 = 70
Correct Answer: Option D
Method 2: Venn Diagram
We have seen that Tree Structure provides a easy way to solve this question.
We can also use a Venn Diagram to solve this question, although this requires a bit of advanced thinking with regards to appropriate selection of sets.
We are given that there are 150 people in a party of which 70 are women and 80 are men. We are given information about the preferences of these people of a drink A.
- 30 out of 70 women prefer drink A.
- This means, 40 women don’t prefer drink A.
- Now, we have to find the number of men who prefer drink A.Let us consider two sets: Women and Drink A.Therefore, our Venn Diagram will look like this:
In this diagram,
- X = Number of men who prefer drink A. This is the number we need to find.
- Y = Number of men who don’t prefer drink A
Now, the sum of the number of people in all the four zones will be equal to the total number of guests at the party.
Thus,
- 40 + 30 + X + Y = 150
That is,
- X + Y = 80 . . . (1)
(Basically, Equation 1 only conveys that the number of men at the party was 80)
Finding required values
We are also given that the number of people who didn’t prefer drink A is 50.
This means,
The number of people who fall outside of the gray circle (The ‘Prefer A’ circle) is 50
Thus,
- 40 + Y = 50
- Y = 10 . . . (2)
Calculating the final answer
Substituting the value of Y in Equation (1) we get:
- X = 70
Thus, the number of men who prefer drink A is 70
Correct Answer: Option D
Community Answer
Of the 150 people in a party, 70 were women. 30 women preferred Drink ...
Let male be x and female be y
x+70y =150
x-30y=-50
Substitute with interchange sign
y =2
x+70(2)=150
x=10
y=70
Total =(x + 10)-70
=150-70
=80-10
=70
d is the answer =70
x+70y =150
x-30y=-50
Substitute with interchange sign
y =2
x+70(2)=150
x=10
y=70
Total =(x + 10)-70
=150-70
=80-10
=70
d is the answer =70


|
Explore Courses for GMAT exam
|
|
Top Courses for GMATView all


Question Description
Of the 150 people in a party, 70 were women. 30 women preferred Drink A. 50 people didn’t prefer Drink A. What was the total number of men who preferred drink A? a)40b)50c)60d)70e)80Correct answer is option 'D'. Can you explain this answer? for GMAT 2025 is part of GMAT preparation. The Question and answers have been prepared according to the GMAT exam syllabus. Information about Of the 150 people in a party, 70 were women. 30 women preferred Drink A. 50 people didn’t prefer Drink A. What was the total number of men who preferred drink A? a)40b)50c)60d)70e)80Correct answer is option 'D'. Can you explain this answer? covers all topics & solutions for GMAT 2025 Exam. Find important definitions, questions, meanings, examples, exercises and tests below for Of the 150 people in a party, 70 were women. 30 women preferred Drink A. 50 people didn’t prefer Drink A. What was the total number of men who preferred drink A? a)40b)50c)60d)70e)80Correct answer is option 'D'. Can you explain this answer?.
Of the 150 people in a party, 70 were women. 30 women preferred Drink A. 50 people didn’t prefer Drink A. What was the total number of men who preferred drink A? a)40b)50c)60d)70e)80Correct answer is option 'D'. Can you explain this answer? for GMAT 2025 is part of GMAT preparation. The Question and answers have been prepared according to the GMAT exam syllabus. Information about Of the 150 people in a party, 70 were women. 30 women preferred Drink A. 50 people didn’t prefer Drink A. What was the total number of men who preferred drink A? a)40b)50c)60d)70e)80Correct answer is option 'D'. Can you explain this answer? covers all topics & solutions for GMAT 2025 Exam. Find important definitions, questions, meanings, examples, exercises and tests below for Of the 150 people in a party, 70 were women. 30 women preferred Drink A. 50 people didn’t prefer Drink A. What was the total number of men who preferred drink A? a)40b)50c)60d)70e)80Correct answer is option 'D'. Can you explain this answer?.
Solutions for Of the 150 people in a party, 70 were women. 30 women preferred Drink A. 50 people didn’t prefer Drink A. What was the total number of men who preferred drink A? a)40b)50c)60d)70e)80Correct answer is option 'D'. Can you explain this answer? in English & in Hindi are available as part of our courses for GMAT.
Download more important topics, notes, lectures and mock test series for GMAT Exam by signing up for free.
Here you can find the meaning of Of the 150 people in a party, 70 were women. 30 women preferred Drink A. 50 people didn’t prefer Drink A. What was the total number of men who preferred drink A? a)40b)50c)60d)70e)80Correct answer is option 'D'. Can you explain this answer? defined & explained in the simplest way possible. Besides giving the explanation of
Of the 150 people in a party, 70 were women. 30 women preferred Drink A. 50 people didn’t prefer Drink A. What was the total number of men who preferred drink A? a)40b)50c)60d)70e)80Correct answer is option 'D'. Can you explain this answer?, a detailed solution for Of the 150 people in a party, 70 were women. 30 women preferred Drink A. 50 people didn’t prefer Drink A. What was the total number of men who preferred drink A? a)40b)50c)60d)70e)80Correct answer is option 'D'. Can you explain this answer? has been provided alongside types of Of the 150 people in a party, 70 were women. 30 women preferred Drink A. 50 people didn’t prefer Drink A. What was the total number of men who preferred drink A? a)40b)50c)60d)70e)80Correct answer is option 'D'. Can you explain this answer? theory, EduRev gives you an
ample number of questions to practice Of the 150 people in a party, 70 were women. 30 women preferred Drink A. 50 people didn’t prefer Drink A. What was the total number of men who preferred drink A? a)40b)50c)60d)70e)80Correct answer is option 'D'. Can you explain this answer? tests, examples and also practice GMAT tests.
|
|
Explore Courses for GMAT exam
|
|

Signup for Free!
Signup to see your scores go up within 7 days! Learn & Practice with 1000+ FREE Notes, Videos & Tests.
|
© EduRev
|
Education Revolution
|


|


Signup to see your scores
go up
within 7 days!
within 7 days!
Takes less than 10 seconds to signup